Differential gene expression analysis
This analysis demonstrates how to perform differential gene expression analysis and covpers topics such as data QC, model fitting and pathway & GO enrichment analysis.
Summary
This Rmarkdown report presents an end-to-end workflow how to perform differential gene expression analysis. For this analysis, we will compare gene expression between disease and treatment groups. We will start the analysis by performing some QC checks, followed by specifying and fitting the model. Because we have two experimental factors, i.e. condition and treatment, we will include both factors in our statistical model. After model building, we will perform statistical testing to see whether changes in log2 fold changes between both treatment groups are statistically significant. We will then visualize the significant, differentially expressed genes and perform enrichment analysis on those gene sets.
Design Matrix
We will start by importing the sample information and creating factors from the experimental conditions to build the experimental design matrix.
code
col_data <- read.csv("./sample_info.tsv", row.names = "sample_name", sep = "\t")

col_data$sample_group <- as.factor(col_data$sample_group)
col_data$condition <- factor(col_data$condition,
    levels = c("group1", "group2", "group3")
)

col_data$sample_name <- row.names(col_data)
col_data$age <- factor(col_data$treatment, levels = c("treatment1", "treatment2"))
kable(col_data[, c("sample_name", "sample_group", "condition", "treatment")], row.names = FALSE) %>%
kable_styling(full_width = FALSE)| sample_name | sample_group | condition | treatment |
|---|---|---|---|
| sampleA1 | sampleA | group1 | treatment1 |
| sampleA2 | sampleA | group1 | treatment1 |
| sampleA3 | sampleA | group1 | treatment1 |
| sampleB1 | sampleB | group2 | treatment1 |
| sampleB2 | sampleB | group2 | treatment1 |
| sampleB3 | sampleB | group2 | treatment1 |
| sampleC2 | sampleC | group3 | treatment2 |
| sampleC3 | sampleC | group3 | treatment2 |
| sampleC1 | sampleC | group3 | treatment2 |
| sampleD1 | sampleD | group3 | treatment1 |
| sampleD2 | sampleD | group3 | treatment1 |
| sampleD3 | sampleD | group3 | treatment1 |
| sampleE1 | sampleE | group3 | treatment2 |
| sampleE2 | sampleE | group3 | treatment2 |
| sampleE3 | sampleE | group3 | treatment2 |
code
contrast_vec <- c("condition", "group2", "group1")
contrast_name <- contrast_vec[1]

model_string <- "~ condition + treatment"
code
counts <- (read.csv(
    file = "./merged_gene_counts.tsv",
    sep = "\t", row.names = "gene_id", header = TRUE,
    strip.white = TRUE, stringsAsFactors = FALSE
))

counts <- counts[, row.names(col_data)]
code
dds_replicates <- DESeqDataSetFromMatrix(
    countData = counts,
    colData = col_data,
    design = formula(model_string)
)

# Collapse technical replicates
dds <- collapseReplicates(dds_replicates, groupby = dds_replicates$sample_group)
QC Analysis
Sequencing Depth
We will have a quick look at sequencing depth per sample to assure that all samples have sufficient read depth for further analysis.
code
options(scipen = 999)

sumdata <- data.frame(colSums(assay(dds_replicates)))
sumdata$Sample <- rownames(sumdata)

ggplot(
    data = sumdata,
    aes(x = Sample, y = colSums.assay.dds_replicates..)
) +
    geom_bar(
        stat = "identity", fill = "steelblue", width = 0.8
    ) +
    scale_x_discrete(guide = guide_axis(angle = 45)) +
    ylab("Read Counts") +
    xlab("Sample") +
    theme_minimal()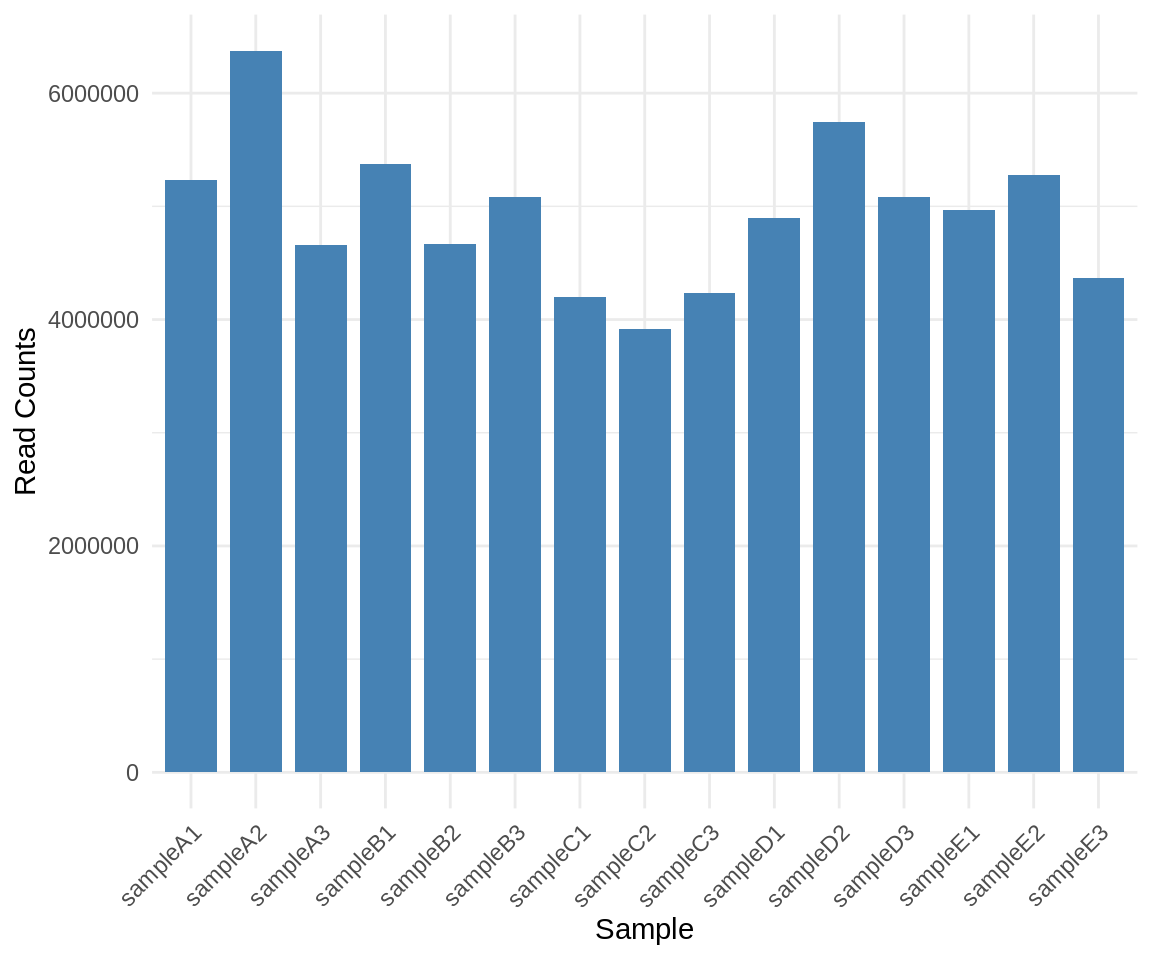
code
sums_df <- data.frame(round(colSums(assay(dds_replicates)) / 1e6, 1))
sums_df$x <- row.names(sums_df)
colnames(sums_df) <- c("Million Reads", "Sample Name")

knitr::kable(sums_df[, c(2, 1)], row.names = FALSE) %>% kable_styling(full_width = FALSE)| Sample Name | Million Reads |
|---|---|
| sampleA1 | 5.2 |
| sampleA2 | 6.4 |
| sampleA3 | 4.7 |
| sampleB1 | 5.4 |
| sampleB2 | 4.7 |
| sampleB3 | 5.1 |
| sampleC2 | 3.9 |
| sampleC3 | 4.2 |
| sampleC1 | 4.2 |
| sampleD1 | 4.9 |
| sampleD2 | 5.7 |
| sampleD3 | 5.1 |
| sampleE1 | 5.0 |
| sampleE2 | 5.3 |
| sampleE3 | 4.4 |
code
options(scipen = 0, digits = 7)Variance Stabilization
Although we will use the raw count data for our statistical analyses, we will also will compute some transformations, which we will use to visualize the data. More specifically, we would like to remove dependence of the variance on the mean. This is particularly importat because the log transform of count data exhibits high variance when the mean count is low. Therefore, we will apply rlog and vsd transformations, which are two transformations for count data provided by the DESeq2 package [Love et al., 2014]
After applying the transformations, we can see that the rlog and vsd transformations remove the high variance for the low means that can be seen with the log transformation.
code
# Plot variance
dds <- estimateSizeFactors(dds)
dds_replicates <- estimateSizeFactors(dds_replicates)


df <- rbind(
    data.frame(log2(counts(dds_replicates, normalized = TRUE)[, 1:2] + 1)) %>%
        mutate(transformation = "log2(x + 1)"),
    data.frame(assay(vsd)[, 1:2]) %>% mutate(transformation = "vst"),
    data.frame(assay(rld)[, 1:2]) %>% mutate(transformation = "rlog")
)

colnames(df)[1:2] <- c("x", "y")

ggplot(df, aes(x = x, y = y)) +
    geom_hex(bins = 80) +
    coord_fixed() +
    facet_grid(. ~ transformation) +
    ylab("standard deviation") +
    xlab("rank(mean)") +
    theme_minimal()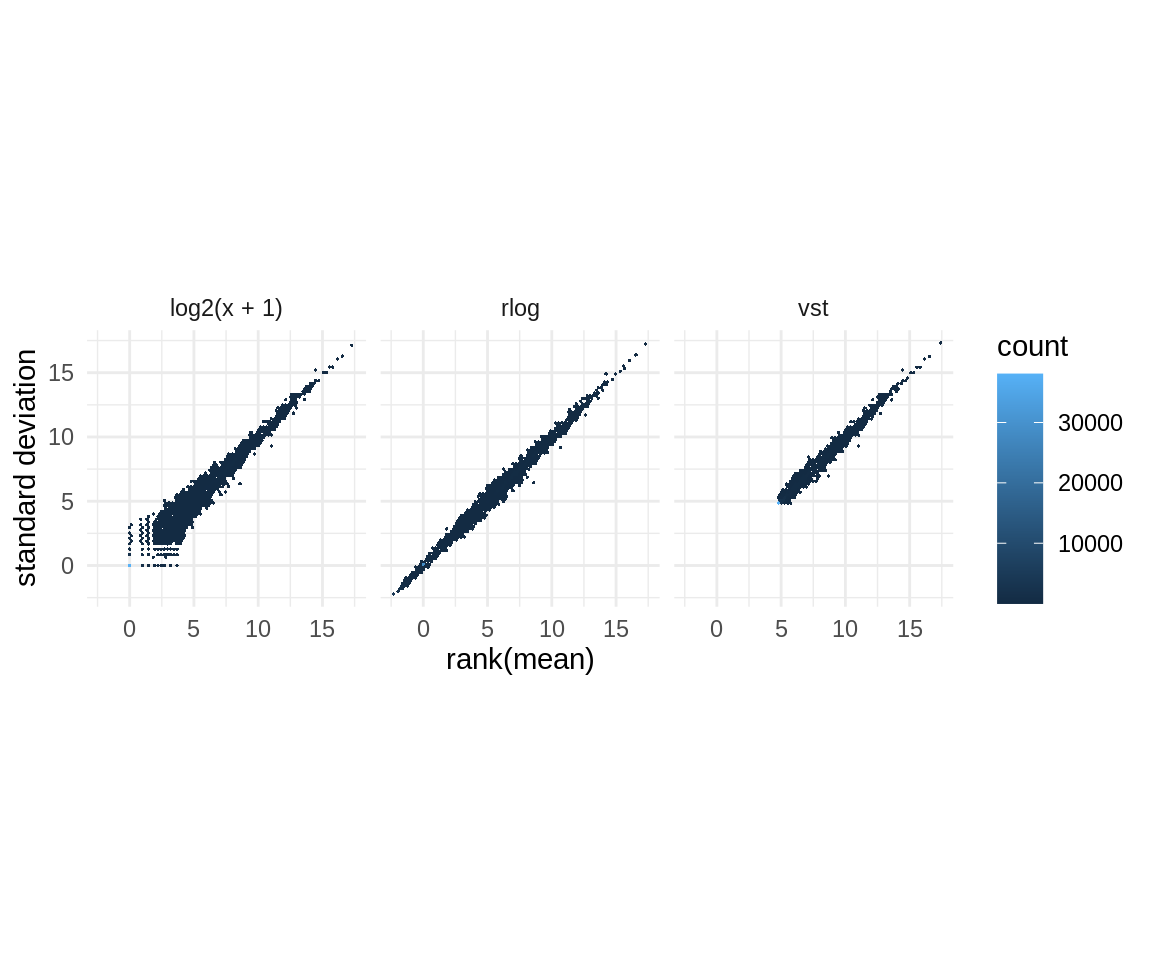
Using the vsd-transformed count data we will plot the standard deviation versus the mean counts and can observe that the high variance in the lower counts is indeed removed.
code
meanSdPlot(assay(vsd))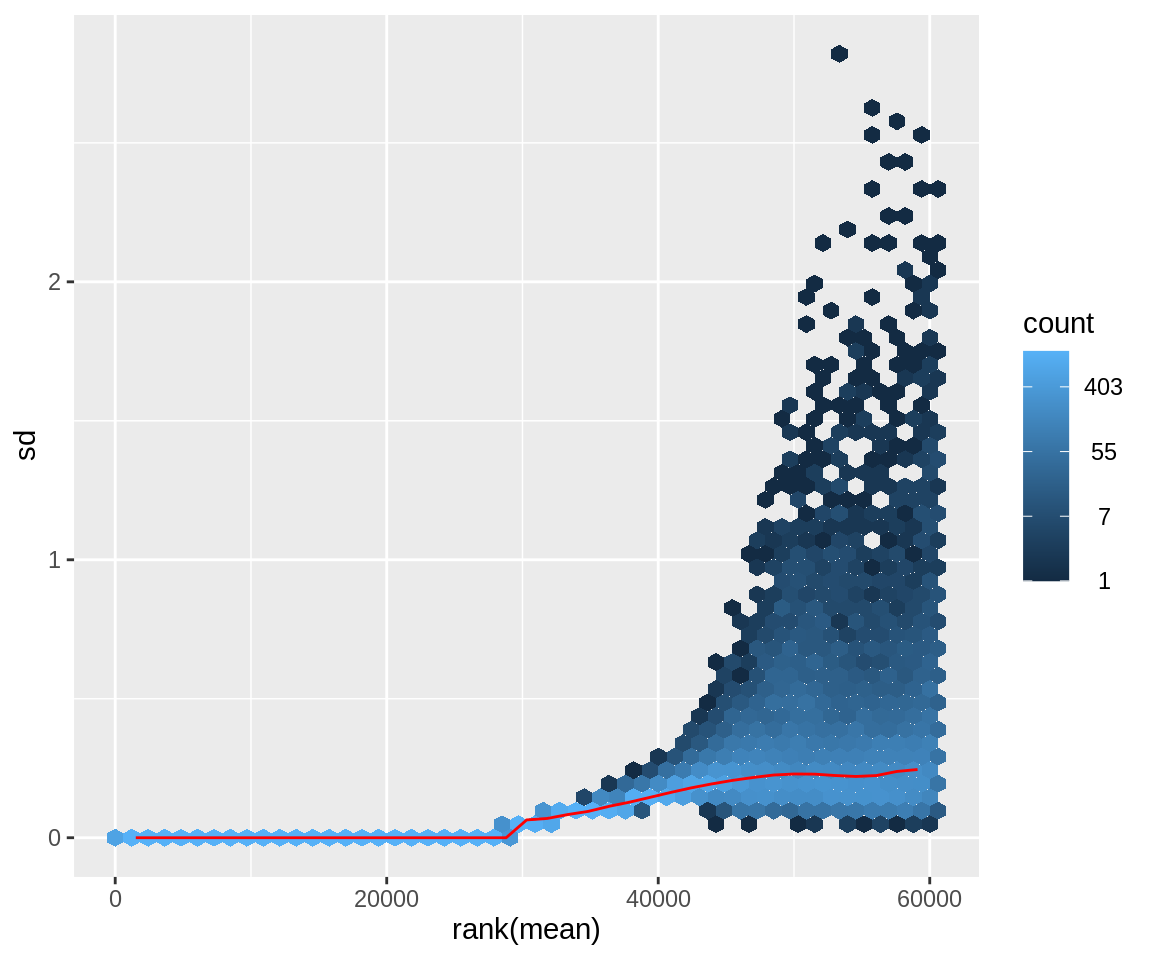
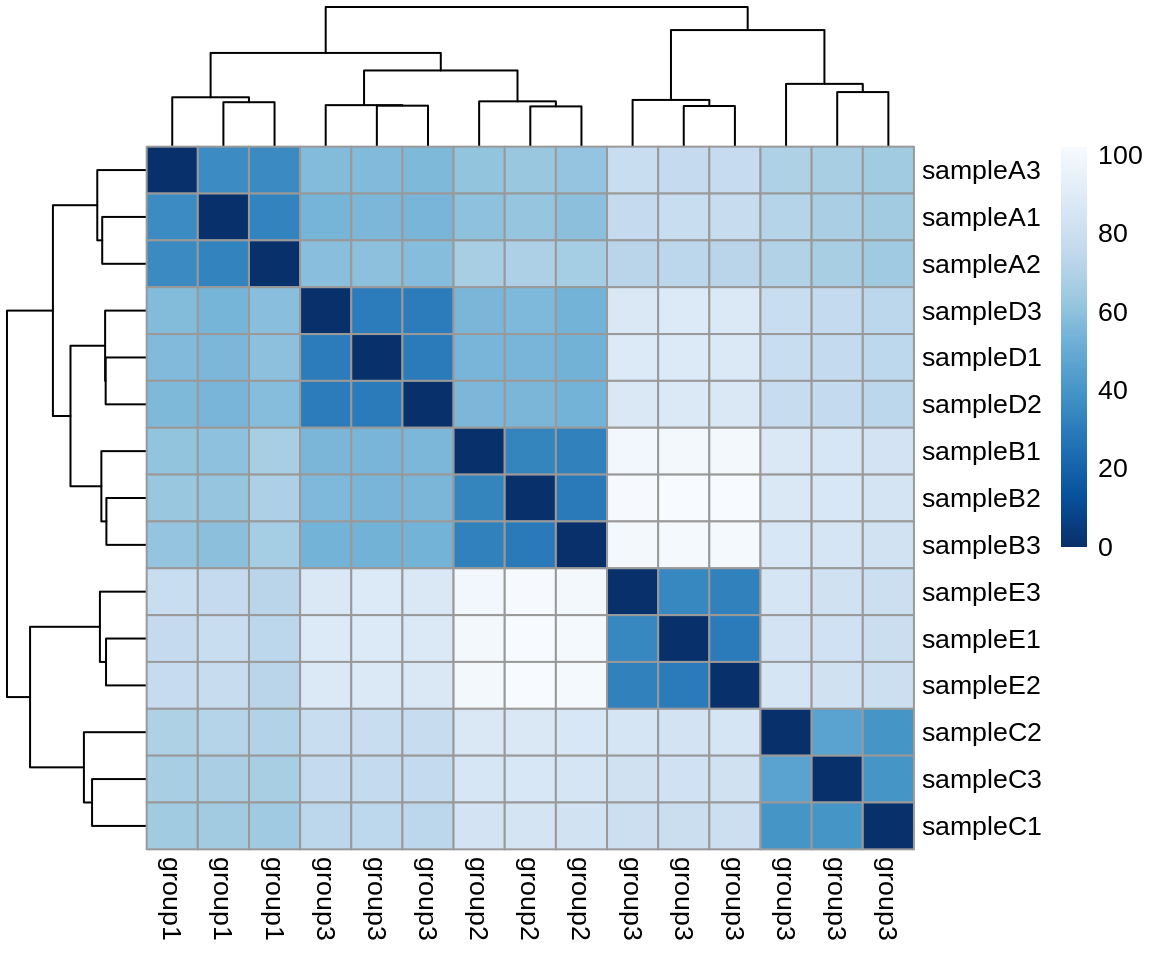
Sample Similarity Matrix (vsd)
Using the vsd-transformed count data, we will create a distance similarity matrix to assess sample similarity.
code
sample_dists <- dist(t(assay(vsd)))
sample_dist_matrix <- as.matrix(sample_dists)
colnames(sample_dist_matrix) <- vsd$condition
rownames(sample_dist_matrix) <- colnames(vsd)
colors <- colorRampPalette(rev(brewer.pal(9, "Blues")))(255)
pheatmap(sample_dist_matrix,
    clustering_distance_rows = sample_dists,
    clustering_distance_cols = sample_dists,
    col = colors
)
PCA Plot (vsd)
Similarly, we will create a PCA plot, which will show the data points in two dimensions (i.e. the two principal components that attribute most to the variance). We will also add a color overlay for the sample groups. This way we can assess whether replicates group together and whether sample groups are separable.
code
pca_data <- plotPCA(vsd, intgroup = "sample_group", returnData = TRUE)
percent_var <- round(100 * attr(pca_data, "percentVar"))
nudge <- position_nudge(y = 5)
my_palette <- c("pink", "blue", "red", "green", "yellow")

ggplot(pca_data, aes(PC1, PC2, color = sample_group)) +
    geom_point(size = 3) +
    xlab(paste0("PC1: ", percent_var[1], "% variance")) +
    ylab(paste0("PC2: ", percent_var[2], "% variance")) +
    # geom_text(aes(label = name), position = nudge) +
    xlim(-50, 50) +
    ylim(-50, 50) +
    scale_colour_manual(values = my_palette) +
    coord_fixed() +
    theme_minimal()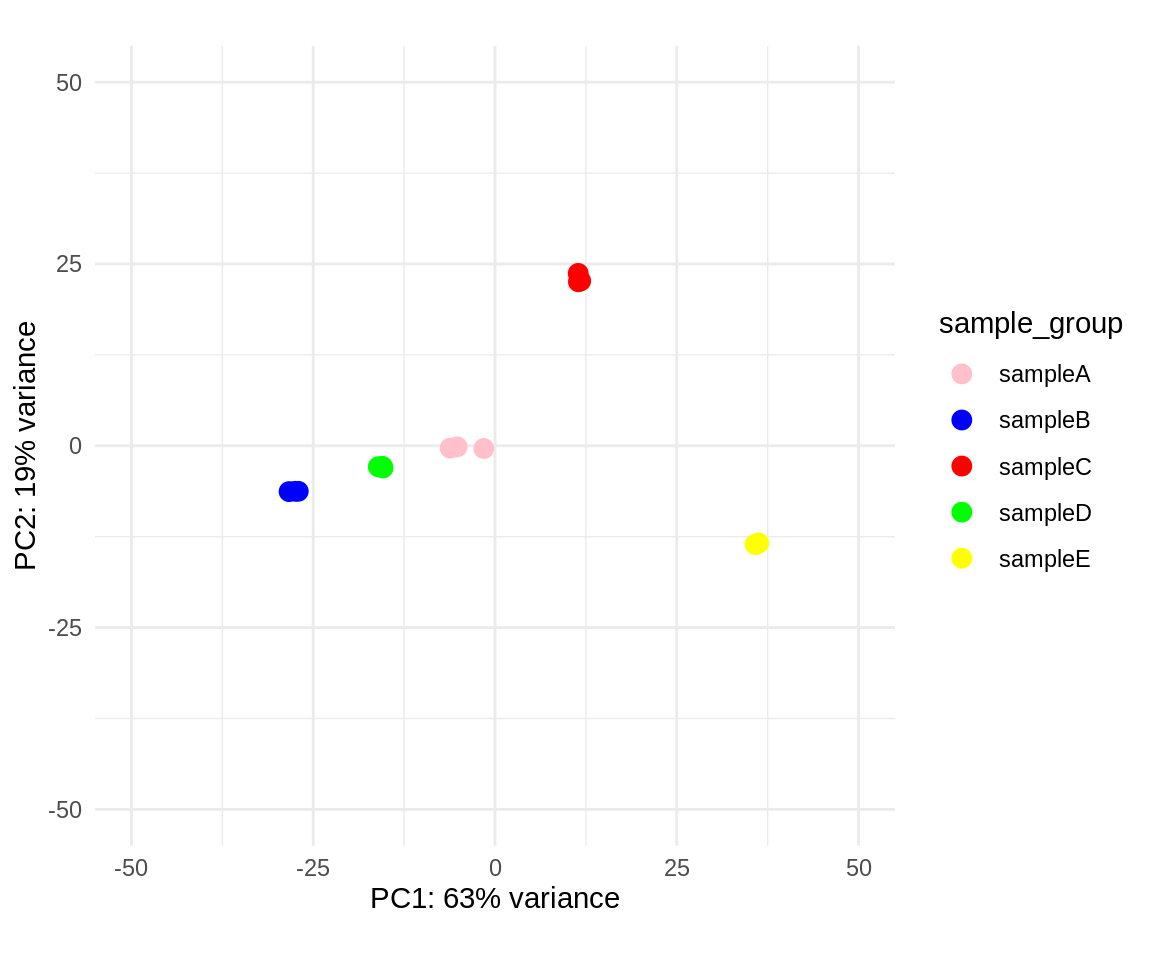
DGE Analysis
We will now perfom differential gene expression analysis using the DESeq2 package. We will add our experimental variables of interest by specifying the following model formula:
\[ \tilde condition + treatment\]
We will also specify which treatment groups we want to compare by defining a contrast. A contrast is a linear combination of estimated log2 fold changes, we can then use this contrast to test if the differences between our groups of interest are equal to zero. For this analysis we want to compare differential gene expression between treatment group 2 relative to our reference group, treatment group 1.
Model Summary
After fitting our model, we can get a summary of differentially expressed genes for our contrast of interest.
code
summary(res)
out of 31781 with nonzero total read count
adjusted p-value < 0.5
LFC > 0 (up)       : 61, 0.19%
LFC < 0 (down)     : 93, 0.29%
outliers [1]       : 0, 0%
low counts [2]     : 16428, 52%
(mean count < 7)
[1] see 'cooksCutoff' argument of ?results
[2] see 'independentFiltering' argument of ?results
Dispersion estimates
As a diagnostid, we can have a look at gene-wise dispersion estimates
code
plotDispEsts(dds)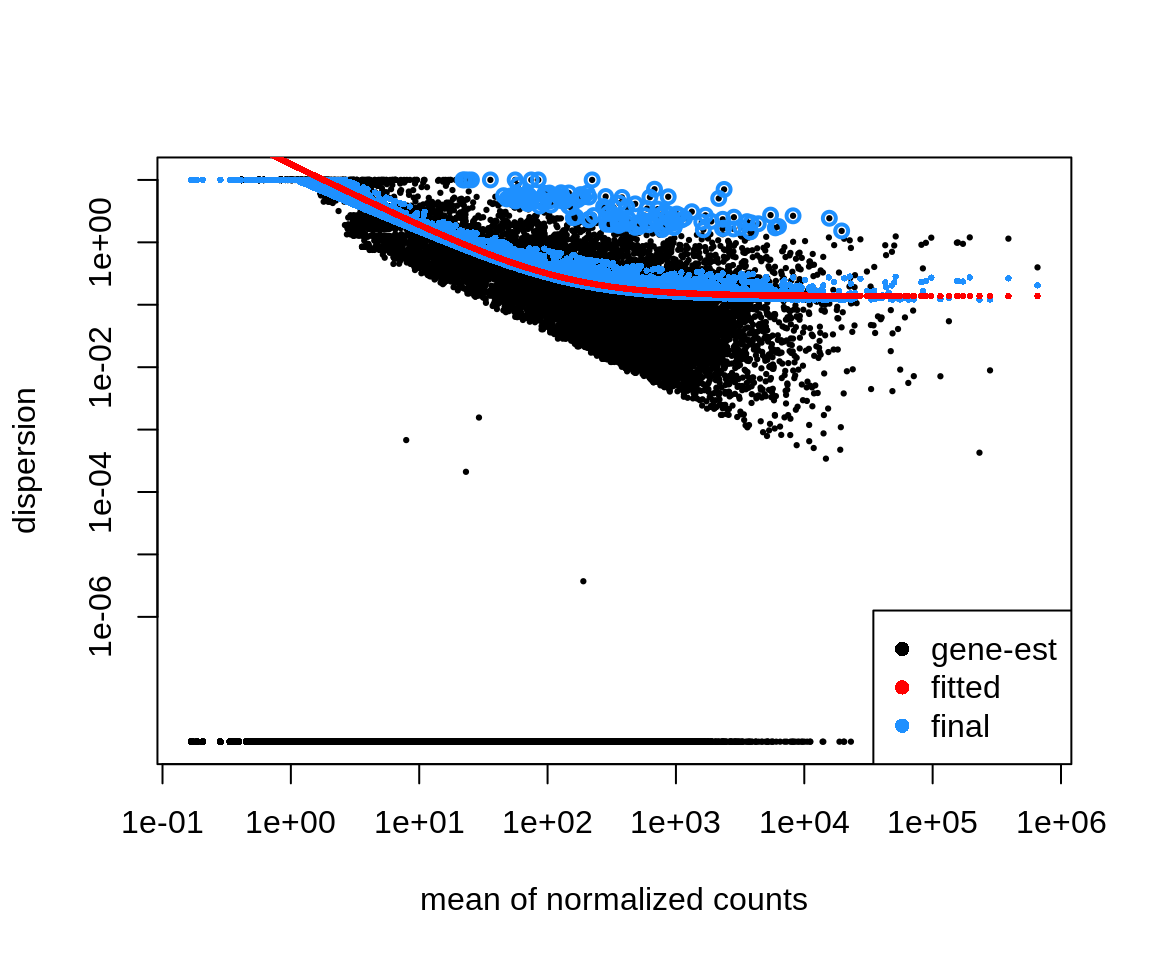
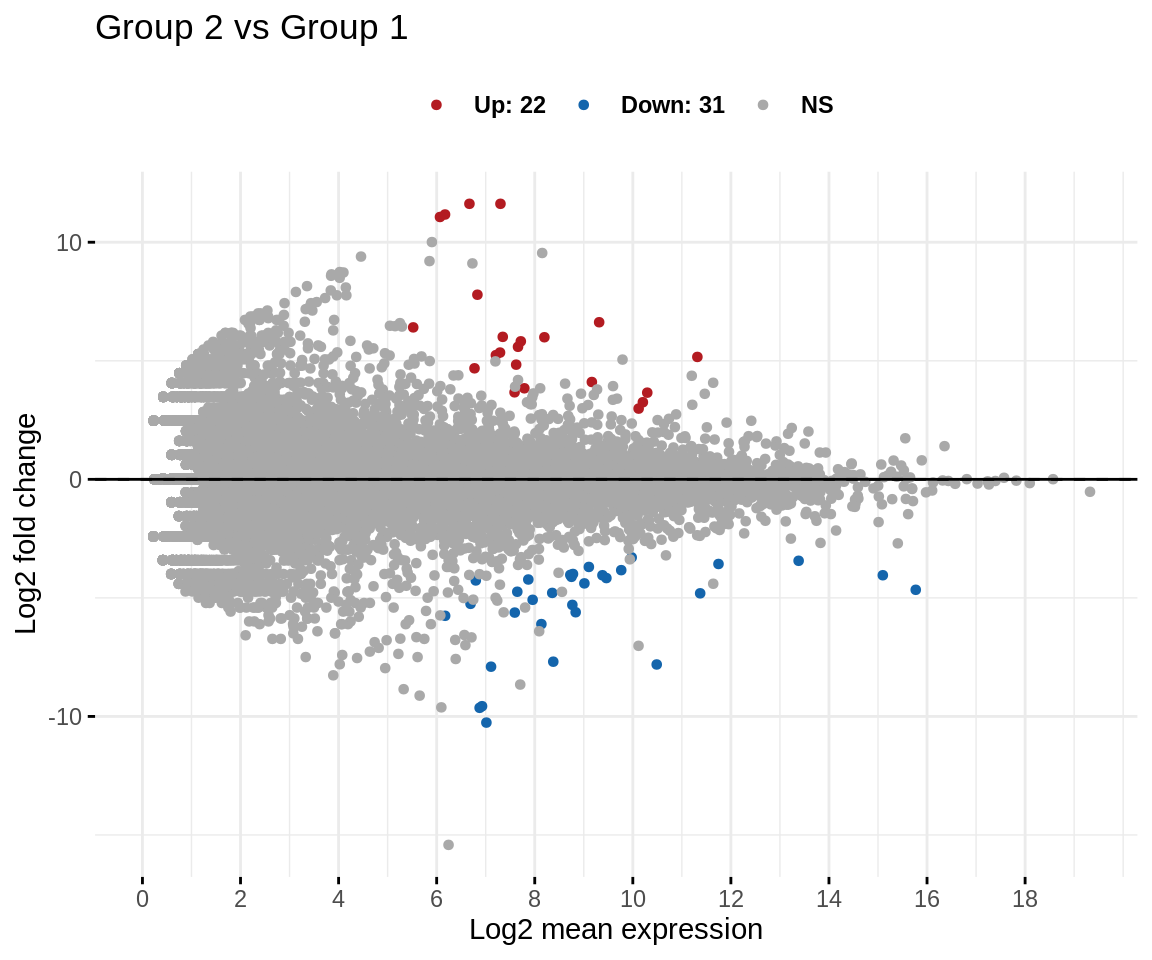
We can create an MA-plot that represents log fold-change versus mean expression between the two treatment groups of interest.
MA plot
code
ggmaplot(res,
    main = expression("Group 2 vs Group 1"),
    fdr = 0.05, fc = 1, size = 1.2,
    palette = c("#B31B21", "#1465AC", "darkgray"),
    genenames = rownames(res),
    legend = "top", top = 0,
    font.label = c("bold", 11),
    font.legend = "bold",
    font.main = "bold",
    ggtheme = ggplot2::theme_minimal()
)
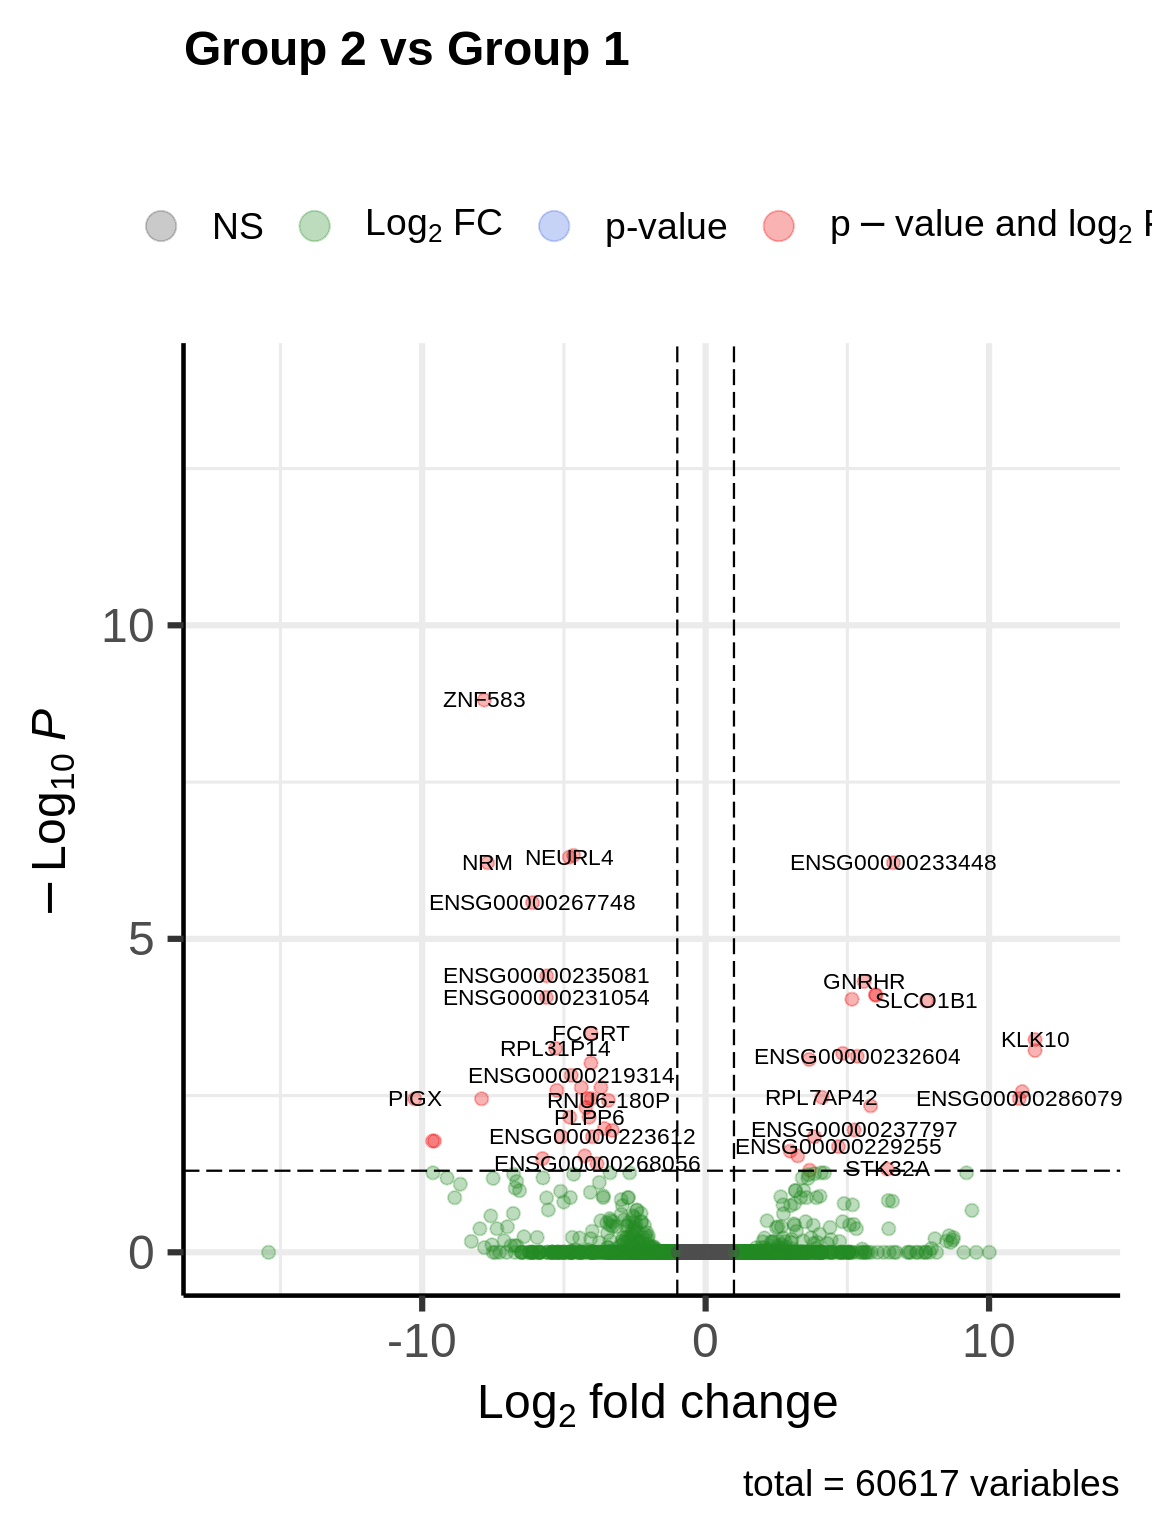
Volcano plot
We can also compare both treatment groups using a volcano plot, where we plot the adjusted P-value (adjusted after Benjamini-Hochberg multiple testing correction) versus log fold-change.
code
ev_hgnc_genes <- mapIds(org.Hs.eg.db,
    keys = row.names(res),
    column = "SYMBOL",
    keytype = "ENSEMBL",
    multiVals = "first"
)

index <- which(is.na(ev_hgnc_genes))
ev_hgnc_genes[index] <- names(ev_hgnc_genes)[index]

EnhancedVolcano(res,
    x = "log2FoldChange",
    y = "padj",
    lab = ev_hgnc_genes,
    pCutoff = 0.05,
    pointSize = 2.0,
    colAlpha = 0.3,
    title = "Group 2 vs Group 1",
    subtitle = "",
    labSize = 3.0
)
Heatmap Top 100 DE Genes
We will also create a heatmap to visualize our 100 most significant, differentially expressed genes. We will cluster both on sample groups and genes.
code
mat <- assay(rld)[head(order(res$padj), 100), ]
mat <- mat - rowMeans(mat)


hgnc_genes <- mapIds(org.Hs.eg.db,
    keys = row.names(mat),
    column = "SYMBOL",
    keytype = "ENSEMBL",
    multiVals = "first"
)

index <- which(is.na(hgnc_genes))
hgnc_genes[index] <- names(hgnc_genes)[index]

row.names(mat) <- hgnc_genes

anno <- as.data.frame(colData(vsd)[, c("condition", "age")])
colnames(anno) <- c("condition", "age")
row.names(anno) <- colnames(vsd)

pheatmap(mat, annotation_col = anno, fontsize = 8) # , annotation_colors = my_colours, color = colorRampPalette(c("blue", "white", "red"))(50), border_color = NA) # , cutree_cols = 3, cutree_rows = 2)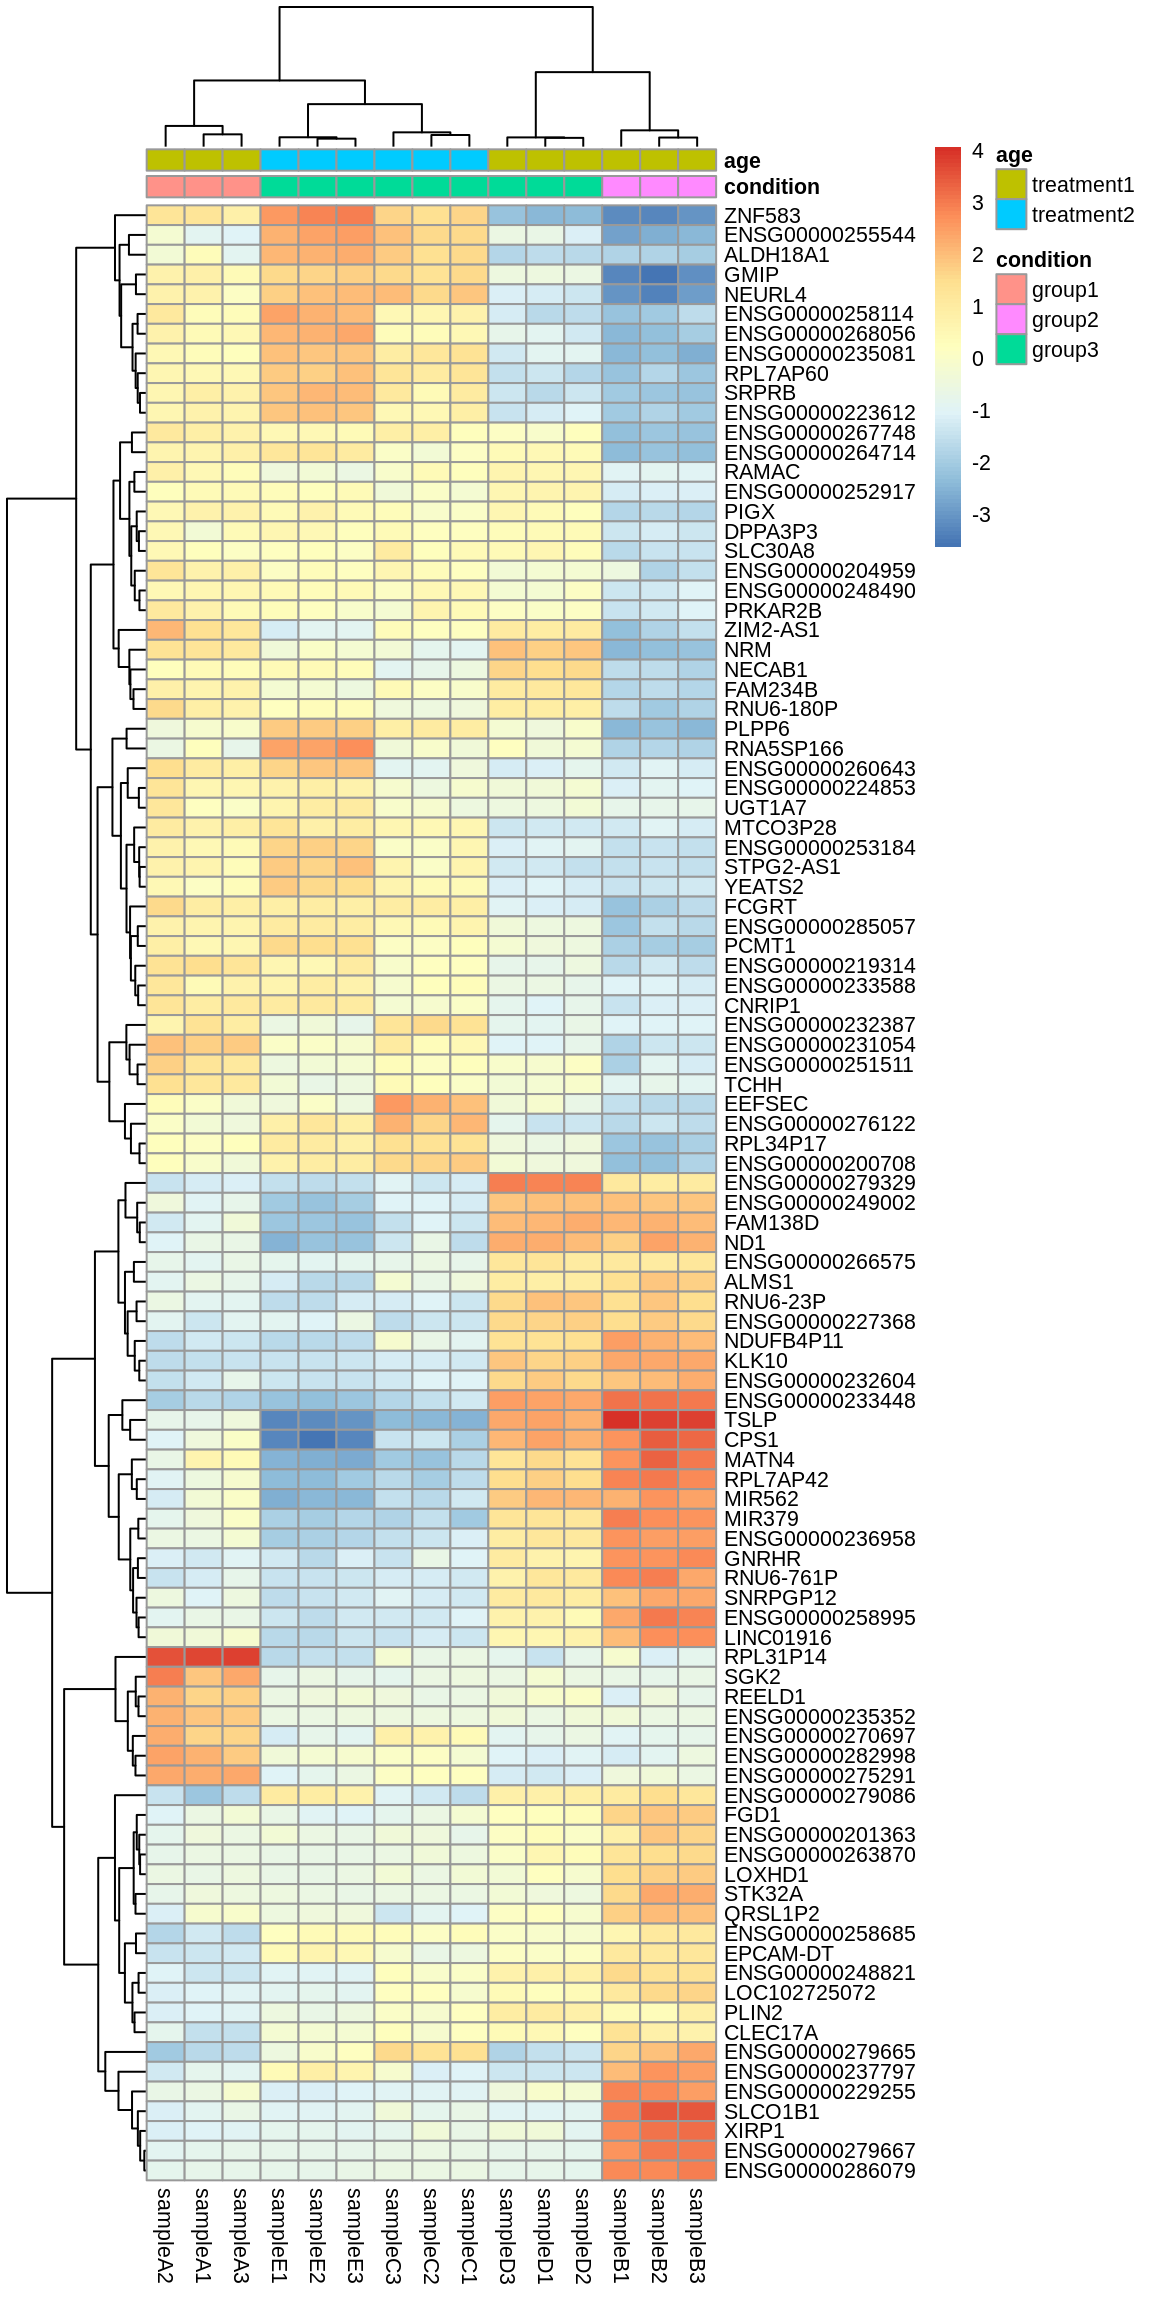
We will annotate the Ensembl gene IDs and with the HUGO gene symbols names and create a table with all differentially expressed genes, which can be used to look up the log2 fold change and significance levels for a particular gene of interest.
code
res_filt <- res[!is.na(res$padj), ]
res_sig <- res_filt[res_filt$padj < 0.05, ]
res_sig <- res_sig[order(res_sig$padj), ]

hgnc_genes <- mapIds(org.Hs.eg.db,
    keys = row.names(res_sig),
    column = "SYMBOL",
    keytype = "ENSEMBL",
    multiVals = "first"
)

res_sig$stat <- NULL
res_sig$lfcSE <- NULL
res_sig$baseMean <- NULL
col_order <- c("EnsemblID", "geneSymbol", colnames(res_sig))
res_sig["EnsemblID"] <- row.names(res_sig)
res_sig["geneSymbol"] <- hgnc_genes
code
DT::datatable(data.frame(res_sig)[, col_order], rownames = FALSE)Pathway analysis
After we have performed differential expression analysis, we will perform gene set enrichment analysis (GSEA) using the GAGE [Luo et al., 2019] Using GSEA, we can determine whether there are sets of genes that are overrepresented in larger groups of genes and that are associated with certain KEGG [Kanehisa et al., 2007] pathways.
code
fold_changes <- res$log2FoldChange


res$entrez <- mapIds(org.Hs.eg.db,
    keys = row.names(res),
    column = "ENTREZID",
    keytype = "ENSEMBL",
    multiVals = "first"
)

names(fold_changes) <- res$entrez

selected_gene_list <- sort(fold_changes, decreasing = TRUE)
gene <- names(selected_gene_list)[abs(selected_gene_list) > 1.5]
KEGG
code
kegg_hs <- kegg.gsets("human")
kegg_set <- kegg_hs$kg.sets[kegg_hs$sigmet.idx]

kegg_res <- gage(fold_changes, gsets = kegg_set, same.dir = TRUE)
KEGG Pathways
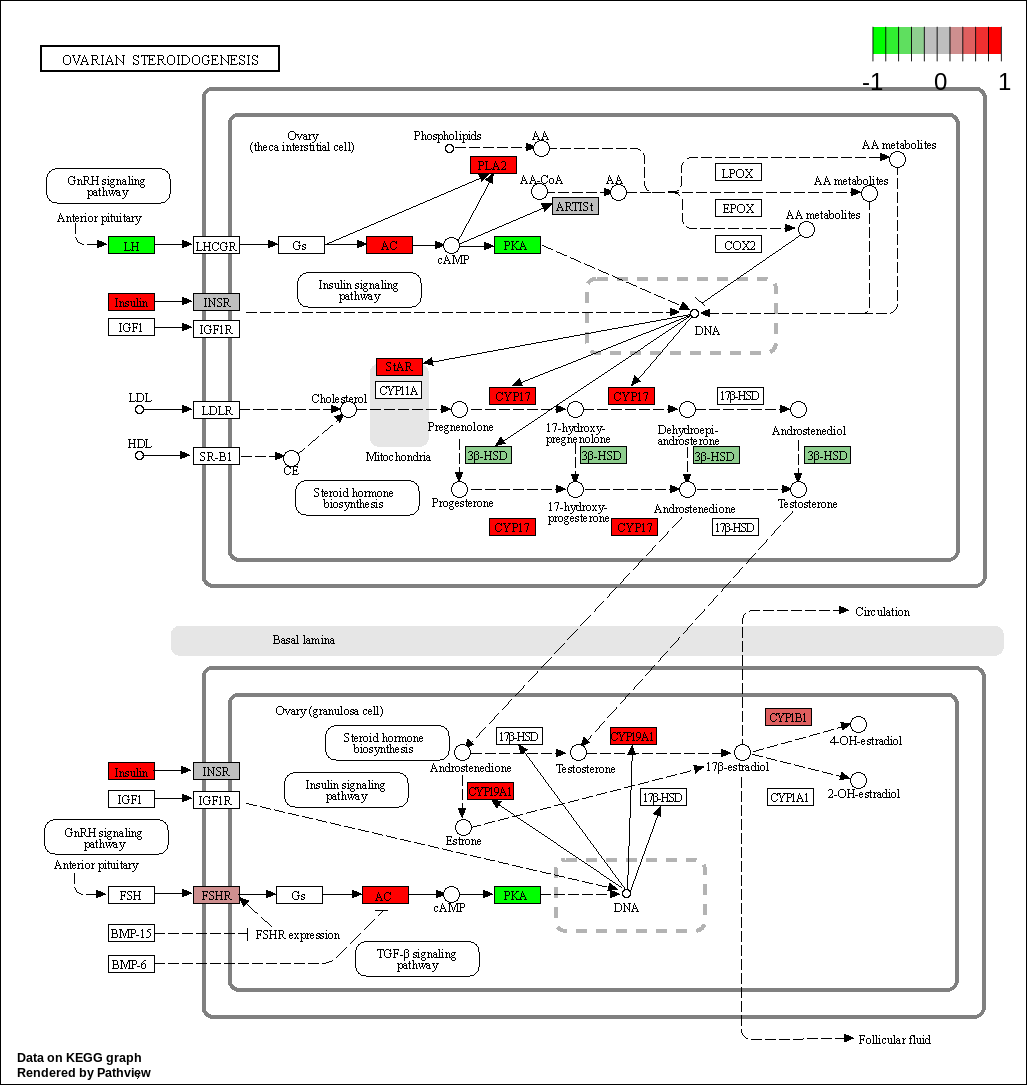
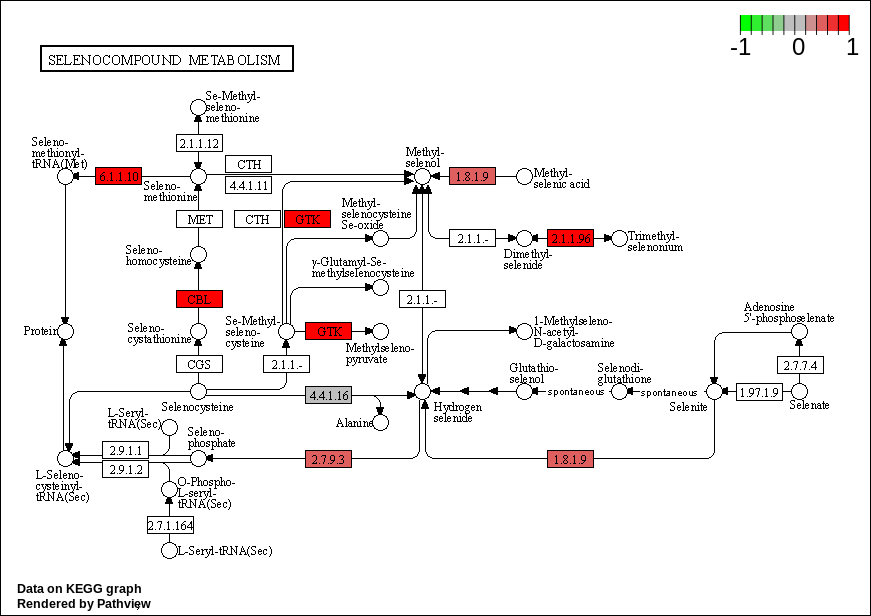
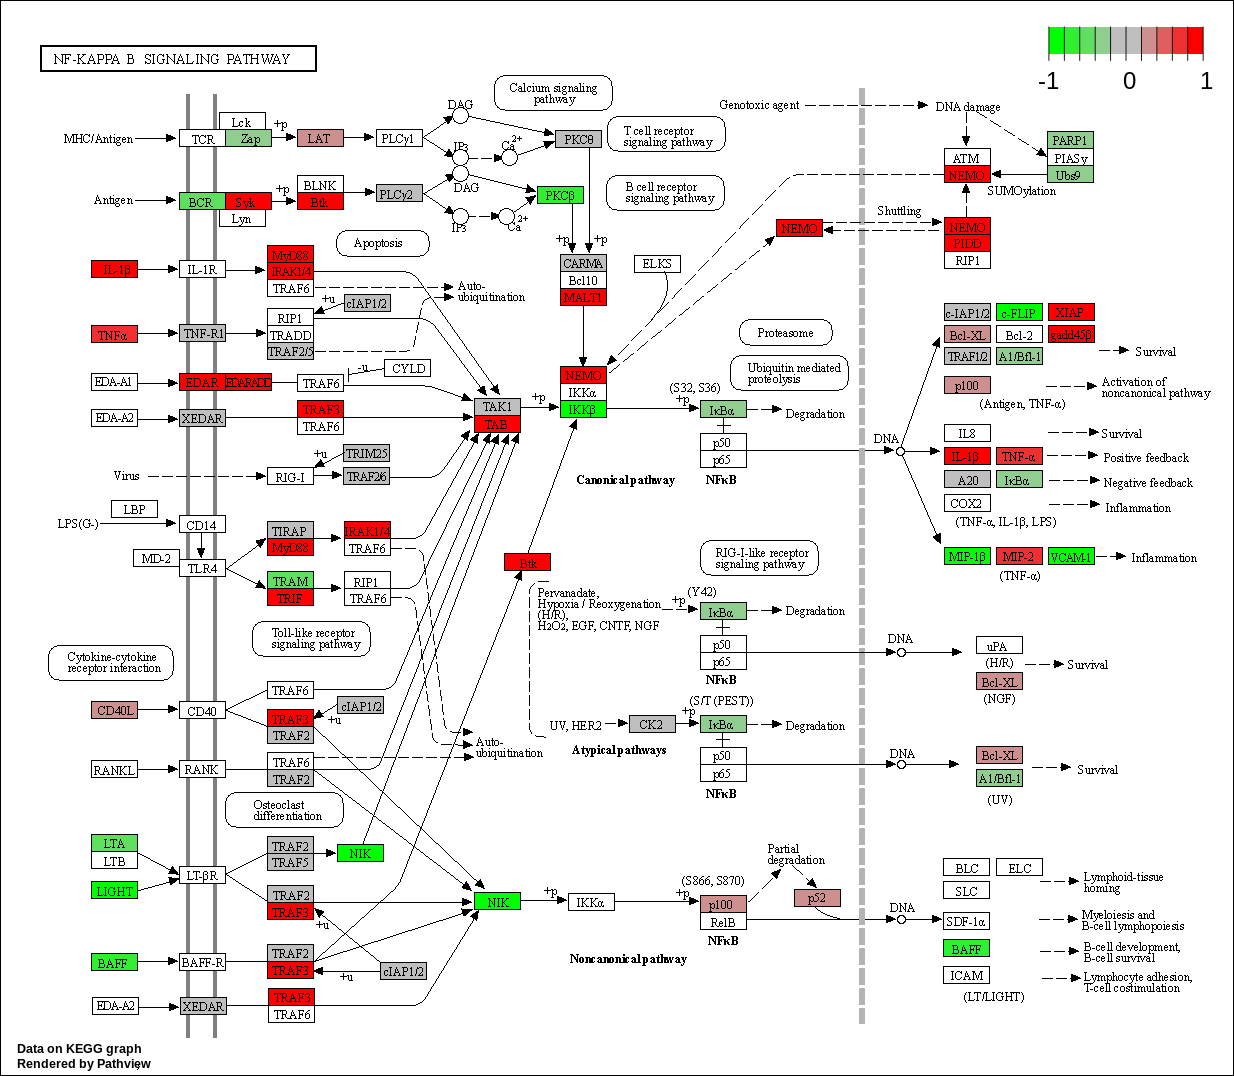
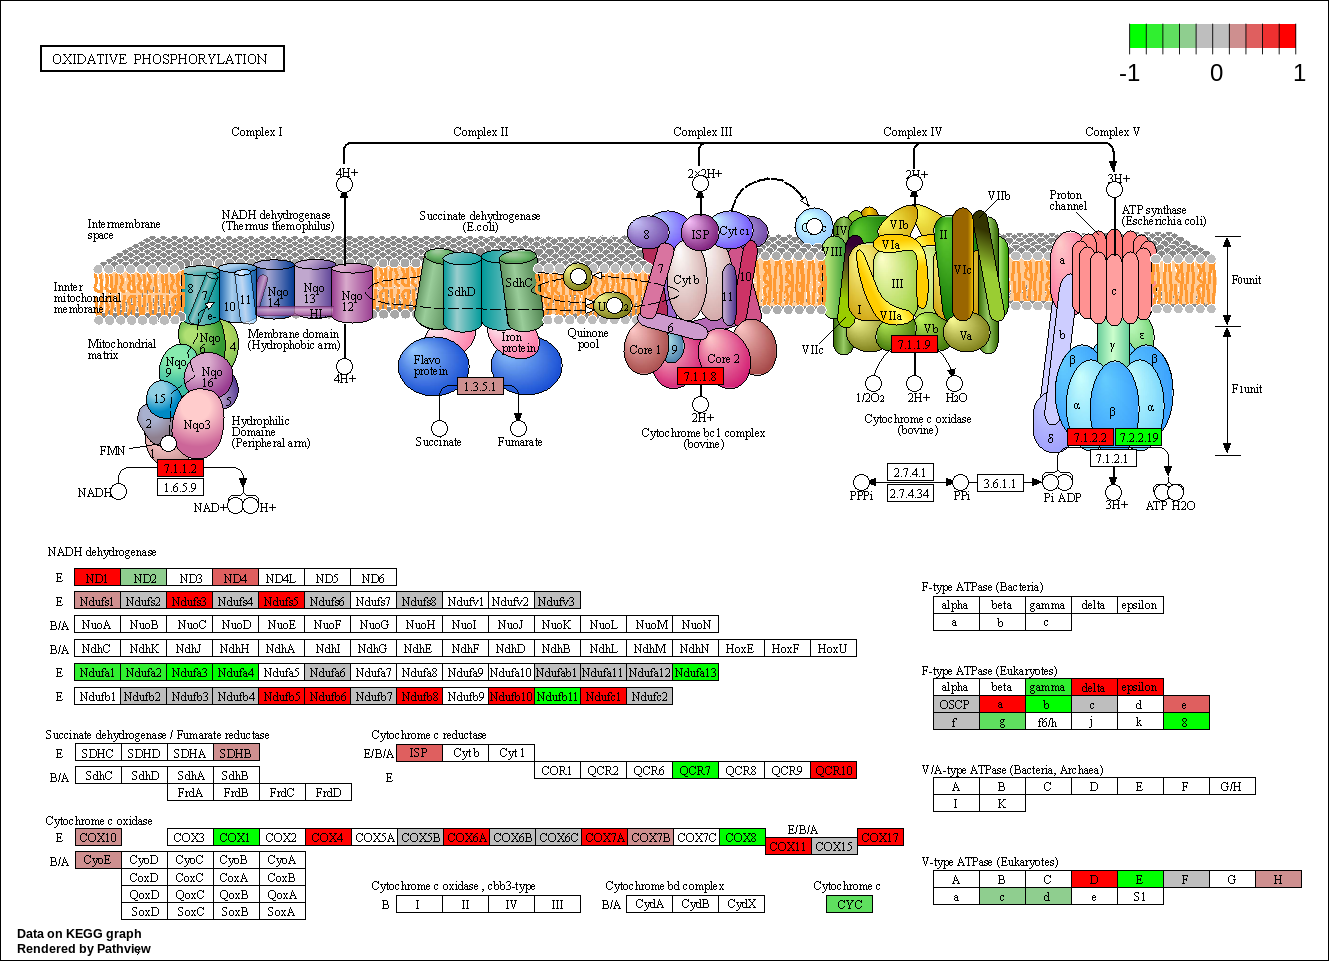
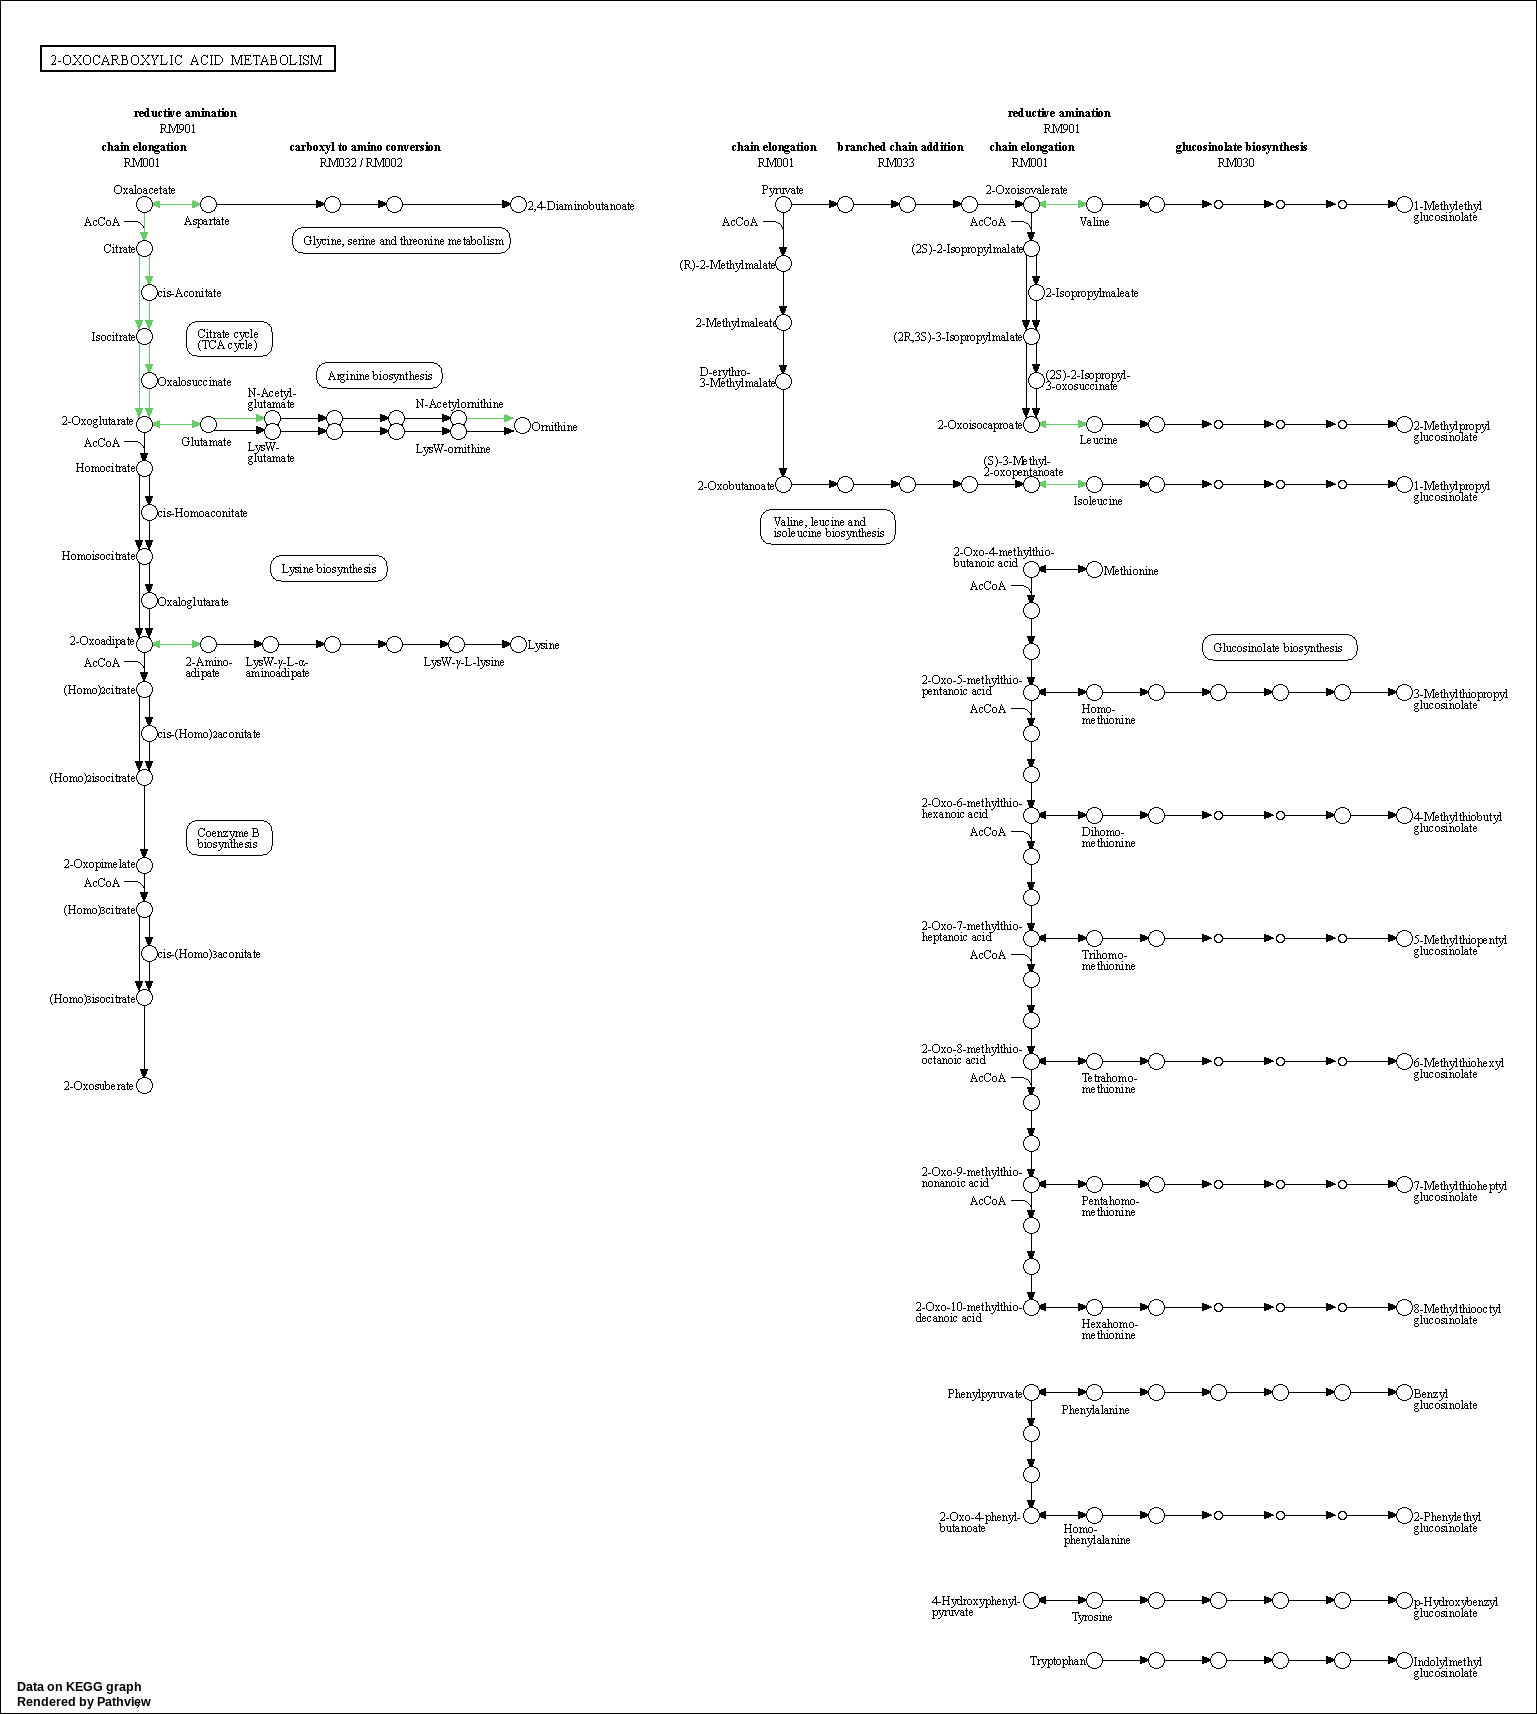
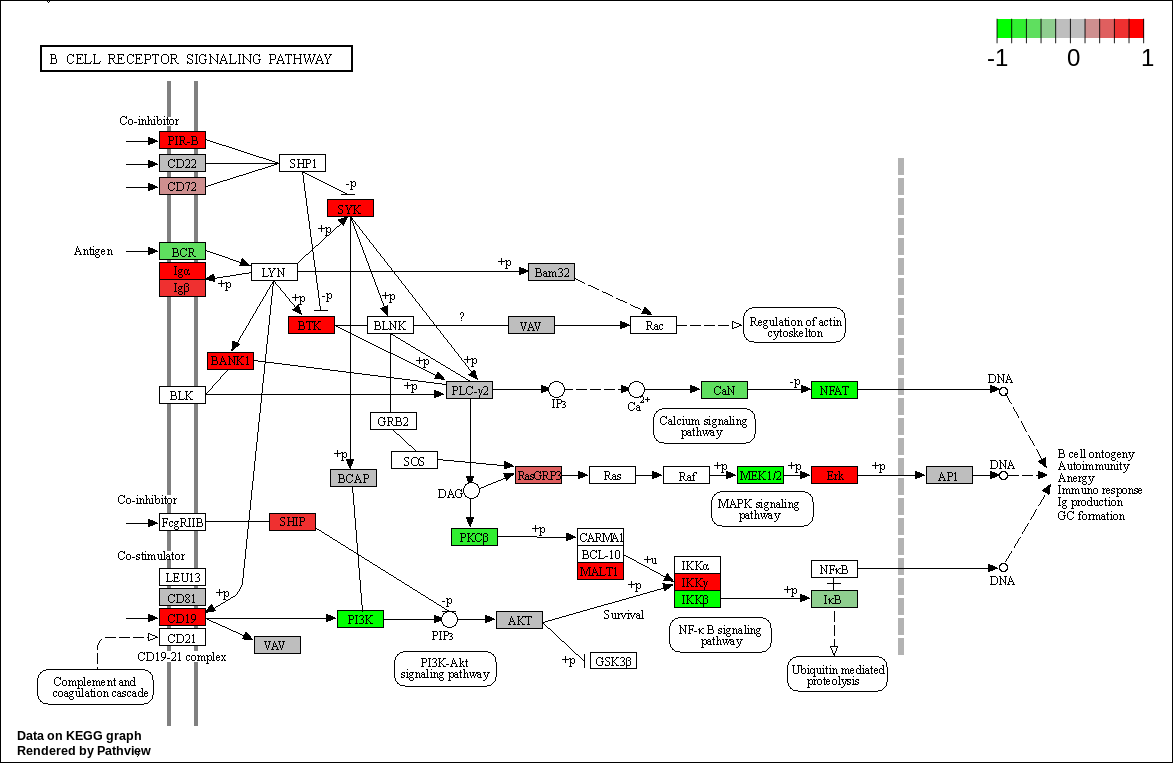
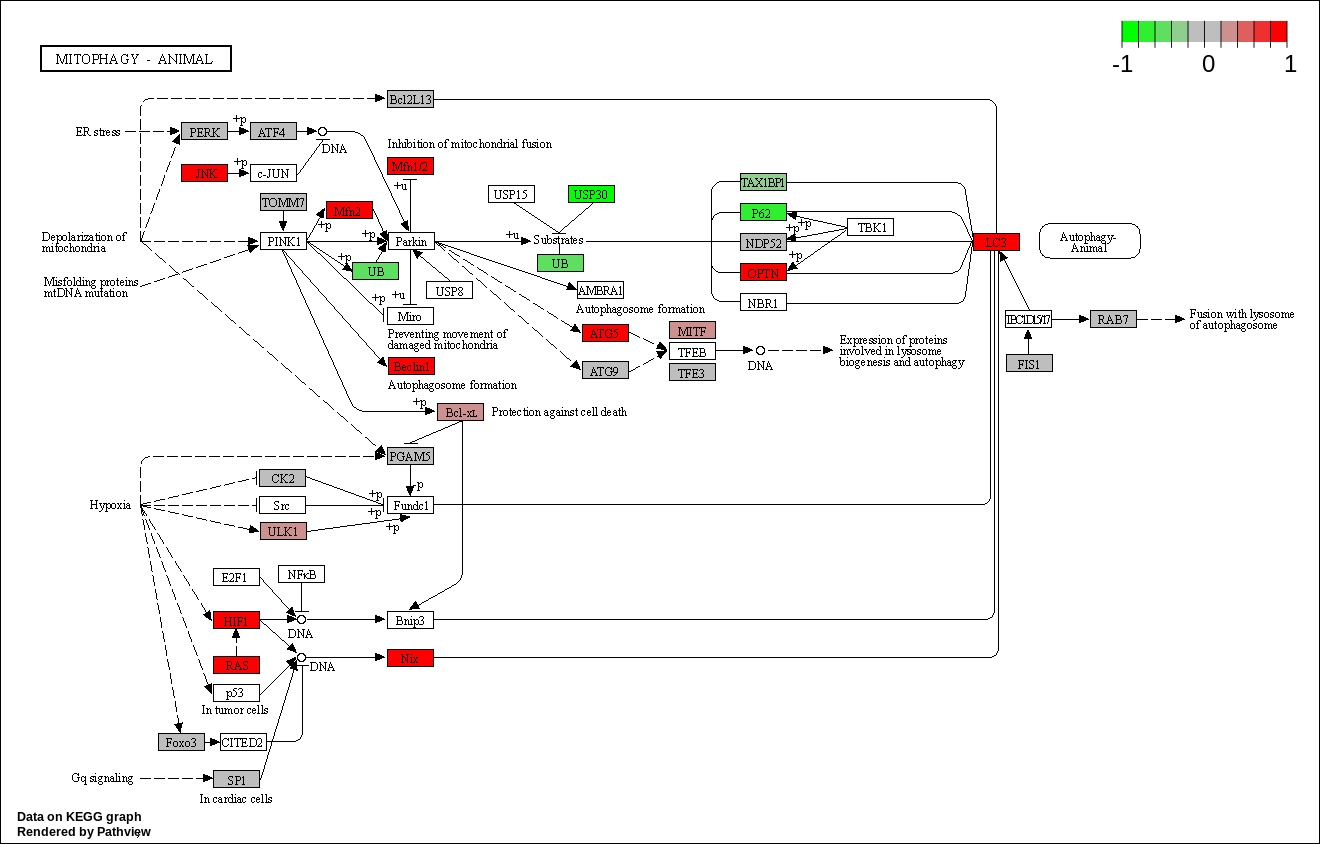
We can overlay the gene sets with corresponding gene sets onto the corresponding KEGG pathways using the Pathview package [Luo et al., 2014]
code
kegg_respathways <- data.frame(id = rownames(kegg_res$greater), kegg_res$greater) %>%
    dplyr::as_tibble() %>%
    dplyr::filter(dplyr::row_number() <= 10) %>%
    .$id %>%
    as.character()

kegg_resids <- substr(kegg_respathways, start = 1, stop = 8)

knitr::kable(as.data.frame(kegg_respathways))| kegg_respathways |
|---|
| hsa00220 Arginine biosynthesis |
| hsa04136 Autophagy - other |
| hsa00900 Terpenoid backbone biosynthesis |
| hsa04913 Ovarian steroidogenesis |
| hsa00450 Selenocompound metabolism |
| hsa04064 NF-kappa B signaling pathway |
| hsa00190 Oxidative phosphorylation |
| hsa01210 2-Oxocarboxylic acid metabolism |
| hsa04662 B cell receptor signaling pathway |
| hsa04137 Mitophagy - animal |
code
plot_pathway <- function(pid) {
    pathview(
        gene.data = fold_changes,
        pathway.id = pid, species = "hsa", new.signature = FALSE
    )
}

tmp <- sapply(kegg_resids, function(pid) pathview(gene.data = fold_changes, pathway.id = pid, species = "hsa"))
rm(tmp)

path_vec <- vector(mode = "character")
for (i in kegg_resids) {
    pathview_file <- paste0(getwd(), "/", i, ".pathview.png")
    if (file.exists(pathview_file)) {
        path_vec <- c(path_vec, pathview_file)
    }
}

knitr::include_graphics(path_vec)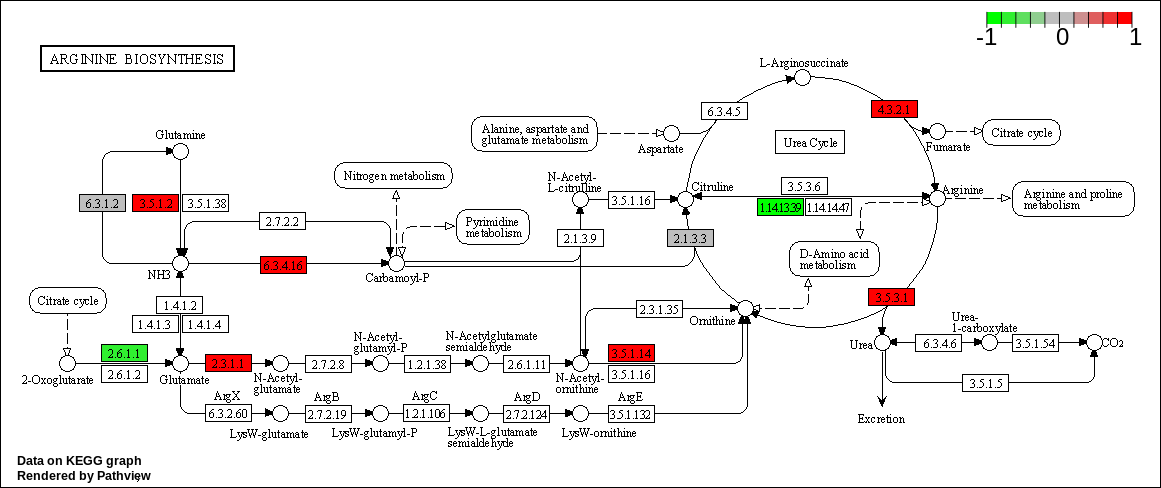
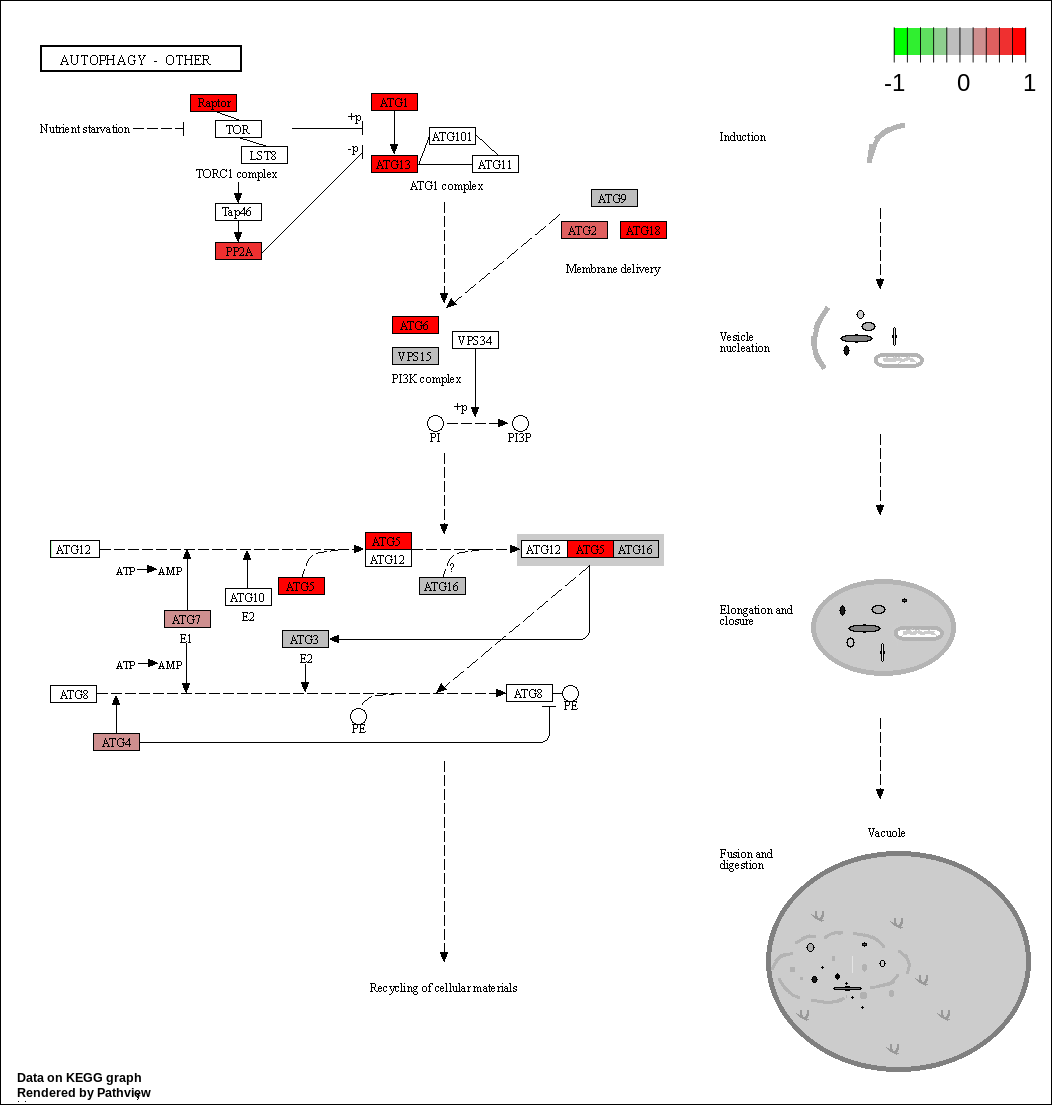
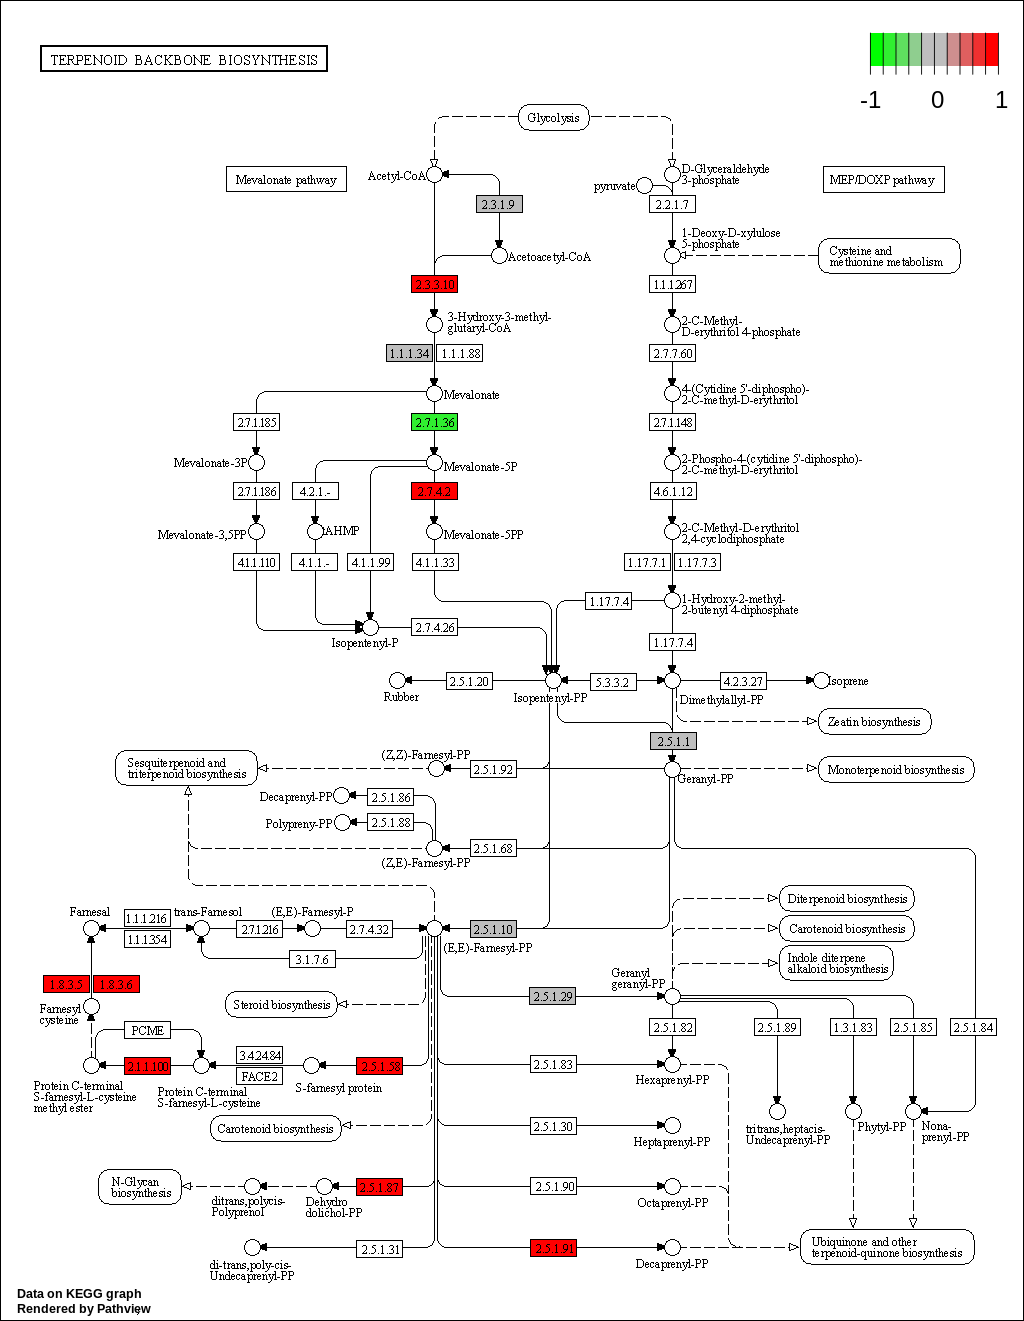
KEGG Greater
code
knitr::kable(as.data.frame(head(kegg_res$greater), n = 50))| p.geomean | stat.mean | p.val | q.val | set.size | exp1 | |
|---|---|---|---|---|---|---|
| hsa00220 Arginine biosynthesis | 0.0164510 | 2.206163 | 0.0164510 | 0.8253476 | 22 | 0.0164510 |
| hsa04136 Autophagy - other | 0.0164654 | 2.186600 | 0.0164654 | 0.8253476 | 32 | 0.0164654 |
| hsa00900 Terpenoid backbone biosynthesis | 0.0198417 | 2.120098 | 0.0198417 | 0.8253476 | 23 | 0.0198417 |
| hsa04913 Ovarian steroidogenesis | 0.0199480 | 2.081996 | 0.0199480 | 0.8253476 | 51 | 0.0199480 |
| hsa00450 Selenocompound metabolism | 0.0214775 | 2.110624 | 0.0214775 | 0.8253476 | 17 | 0.0214775 |
| hsa04064 NF-kappa B signaling pathway | 0.0220919 | 2.024995 | 0.0220919 | 0.8253476 | 103 | 0.0220919 |
KEGG Less
code
knitr::kable(as.data.frame(head(kegg_res$less), n = 50))| p.geomean | stat.mean | p.val | q.val | set.size | exp1 | |
|---|---|---|---|---|---|---|
| hsa03013 RNA transport | 0.0004363 | -3.376259 | 0.0004363 | 0.1025302 | 108 | 0.0004363 |
| hsa04020 Calcium signaling pathway | 0.0054291 | -2.557342 | 0.0054291 | 0.6379141 | 240 | 0.0054291 |
| hsa04512 ECM-receptor interaction | 0.0136538 | -2.225893 | 0.0136538 | 0.8157525 | 88 | 0.0136538 |
| hsa04392 Hippo signaling pathway - multiple species | 0.0138851 | -2.270880 | 0.0138851 | 0.8157525 | 29 | 0.0138851 |
| hsa00670 One carbon pool by folate | 0.0190081 | -2.149683 | 0.0190081 | 0.8214288 | 20 | 0.0190081 |
| hsa04390 Hippo signaling pathway | 0.0209726 | -2.042781 | 0.0209726 | 0.8214288 | 157 | 0.0209726 |
We will also perform an Gene Ontology (GO) [Gene Ontology consortium, 2004]enrichment analysis to see whether there are any overrepresented gene sets that can be associated with GO molucular function, cellular location or biological process.
Gene Ontology
code
go_dr <- go.gsets(species = "human")
go_bp <- go_dr$go.sets[go_dr$go.subs$BP]
go_mf <- go_dr$go.sets[go_dr$go.subs$MF]
go_cc <- go_dr$go.sets[go_dr$go.subs$CC]
code
go_bp_res <- gage(fold_changes, gsets = go_bp, same.dir = TRUE)
go_tb_bp <- lapply(go_bp_res, function(x) head(x, n = 50))
GO Biological Process
GO Biological Process Greater
code
knitr::kable(go_tb_bp$greater[, c(3, 5)])| p.val | set.size | |
|---|---|---|
| GO:0071609 chemokine (C-C motif) ligand 5 production | 0.0003177 | 11 |
| GO:0071649 regulation of chemokine (C-C motif) ligand 5 production | 0.0003177 | 11 |
| GO:1901215 negative regulation of neuron death | 0.0006379 | 208 |
| GO:0060416 response to growth hormone | 0.0006677 | 37 |
| GO:0014743 regulation of muscle hypertrophy | 0.0007841 | 72 |
| GO:0014741 negative regulation of muscle hypertrophy | 0.0009266 | 36 |
| GO:0003306 Wnt signaling pathway involved in heart development | 0.0010569 | 12 |
| GO:0061050 regulation of cell growth involved in cardiac muscle cell development | 0.0013388 | 23 |
| GO:0010611 regulation of cardiac muscle hypertrophy | 0.0016427 | 69 |
| GO:0061512 protein localization to cilium | 0.0019922 | 65 |
| GO:0046643 regulation of gamma-delta T cell activation | 0.0022130 | 11 |
| GO:1902959 regulation of aspartic-type endopeptidase activity involved in amyloid precursor protein catabolic process | 0.0022310 | 10 |
| GO:0031667 response to nutrient levels | 0.0023018 | 474 |
| GO:0048261 negative regulation of receptor-mediated endocytosis | 0.0023186 | 34 |
| GO:0022900 electron transport chain | 0.0024763 | 173 |
| GO:0010614 negative regulation of cardiac muscle hypertrophy | 0.0025410 | 34 |
| GO:0010288 response to lead ion | 0.0026533 | 24 |
| GO:0032094 response to food | 0.0027094 | 40 |
| GO:0019646 aerobic electron transport chain | 0.0028331 | 86 |
| GO:0050686 negative regulation of mRNA processing | 0.0032088 | 29 |
| GO:0014896 muscle hypertrophy | 0.0032653 | 104 |
| GO:0043502 regulation of muscle adaptation | 0.0032916 | 98 |
| GO:0002679 respiratory burst involved in defense response | 0.0038203 | 15 |
| GO:0099068 postsynapse assembly | 0.0038415 | 30 |
| GO:0071378 cellular response to growth hormone stimulus | 0.0038416 | 24 |
| GO:0042773 ATP synthesis coupled electron transport | 0.0042839 | 94 |
| GO:0042775 mitochondrial ATP synthesis coupled electron transport | 0.0042839 | 94 |
| GO:0031398 positive regulation of protein ubiquitination | 0.0043871 | 118 |
| GO:0031058 positive regulation of histone modification | 0.0044565 | 92 |
| GO:0006869 lipid transport | 0.0045004 | 398 |
| GO:0045806 negative regulation of endocytosis | 0.0046206 | 53 |
| GO:0006120 mitochondrial electron transport, NADH to ubiquinone | 0.0047017 | 51 |
| GO:0006119 oxidative phosphorylation | 0.0047397 | 139 |
| GO:2000252 negative regulation of feeding behavior | 0.0047662 | 10 |
| GO:0007422 peripheral nervous system development | 0.0048156 | 80 |
| GO:0003300 cardiac muscle hypertrophy | 0.0050263 | 99 |
| GO:0014897 striated muscle hypertrophy | 0.0052500 | 102 |
| GO:0022904 respiratory electron transport chain | 0.0053752 | 113 |
| GO:0032372 negative regulation of sterol transport | 0.0054484 | 29 |
| GO:0032375 negative regulation of cholesterol transport | 0.0054484 | 29 |
| GO:0007595 lactation | 0.0055363 | 47 |
| GO:0030879 mammary gland development | 0.0056752 | 136 |
| GO:0070997 neuron death | 0.0059092 | 360 |
| GO:1903322 positive regulation of protein modification by small protein conjugation or removal | 0.0059925 | 137 |
| GO:1905288 vascular associated smooth muscle cell apoptotic process | 0.0061585 | 15 |
| GO:1905459 regulation of vascular associated smooth muscle cell apoptotic process | 0.0061585 | 15 |
| GO:0043434 response to peptide hormone | 0.0061681 | 414 |
| GO:0098903 regulation of membrane repolarization during action potential | 0.0063469 | 10 |
| GO:1901214 regulation of neuron death | 0.0064285 | 319 |
| GO:0043984 histone H4-K16 acetylation | 0.0064479 | 20 |
GO Biological Process Lesser
code
knitr::kable(go_tb_bp$less[, c(3, 5)])| p.val | set.size | |
|---|---|---|
| GO:1904152 regulation of retrograde protein transport, ER to cytosol | 0.0000707 | 13 |
| GO:2000659 regulation of interleukin-1-mediated signaling pathway | 0.0001051 | 10 |
| GO:0090026 positive regulation of monocyte chemotaxis | 0.0002765 | 21 |
| GO:0071677 positive regulation of mononuclear cell migration | 0.0012928 | 65 |
| GO:1902548 negative regulation of cellular response to vascular endothelial growth factor stimulus | 0.0015167 | 18 |
| GO:0099188 postsynaptic cytoskeleton organization | 0.0015376 | 13 |
| GO:0098917 retrograde trans-synaptic signaling | 0.0015502 | 10 |
| GO:0002363 alpha-beta T cell lineage commitment | 0.0017586 | 23 |
| GO:0043369 CD4-positive or CD8-positive, alpha-beta T cell lineage commitment | 0.0017586 | 23 |
| GO:0033539 fatty acid beta-oxidation using acyl-CoA dehydrogenase | 0.0023344 | 11 |
| GO:0072683 T cell extravasation | 0.0025167 | 12 |
| GO:0019372 lipoxygenase pathway | 0.0026017 | 11 |
| GO:1900747 negative regulation of vascular endothelial growth factor signaling pathway | 0.0026297 | 16 |
| GO:0043373 CD4-positive, alpha-beta T cell lineage commitment | 0.0026634 | 21 |
| GO:0051893 regulation of focal adhesion assembly | 0.0032701 | 66 |
| GO:0090109 regulation of cell-substrate junction assembly | 0.0032701 | 66 |
| GO:0098974 postsynaptic actin cytoskeleton organization | 0.0033238 | 11 |
| GO:0070301 cellular response to hydrogen peroxide | 0.0033906 | 98 |
| GO:0050820 positive regulation of coagulation | 0.0034433 | 24 |
| GO:0035329 hippo signaling | 0.0036440 | 39 |
| GO:0030194 positive regulation of blood coagulation | 0.0037661 | 23 |
| GO:1900048 positive regulation of hemostasis | 0.0037661 | 23 |
| GO:0150116 regulation of cell-substrate junction organization | 0.0037829 | 71 |
| GO:0043062 extracellular structure organization | 0.0044317 | 301 |
| GO:0034111 negative regulation of homotypic cell-cell adhesion | 0.0046770 | 14 |
| GO:0007160 cell-matrix adhesion | 0.0049950 | 233 |
| GO:0030198 extracellular matrix organization | 0.0050381 | 300 |
| GO:0030193 regulation of blood coagulation | 0.0055973 | 66 |
| GO:0045229 external encapsulating structure organization | 0.0056594 | 303 |
| GO:0090303 positive regulation of wound healing | 0.0057654 | 59 |
| GO:0002360 T cell lineage commitment | 0.0059351 | 29 |
| GO:2001222 regulation of neuron migration | 0.0059738 | 42 |
| GO:1901722 regulation of cell proliferation involved in kidney development | 0.0062443 | 14 |
| GO:1900006 positive regulation of dendrite development | 0.0063941 | 18 |
| GO:0010544 negative regulation of platelet activation | 0.0067846 | 19 |
| GO:0035023 regulation of Rho protein signal transduction | 0.0068442 | 86 |
| GO:0050818 regulation of coagulation | 0.0071531 | 71 |
| GO:0030539 male genitalia development | 0.0074684 | 23 |
| GO:0031589 cell-substrate adhesion | 0.0075177 | 363 |
| GO:0002687 positive regulation of leukocyte migration | 0.0076809 | 135 |
| GO:0090331 negative regulation of platelet aggregation | 0.0081961 | 12 |
| GO:0007588 excretion | 0.0088250 | 62 |
| GO:0034113 heterotypic cell-cell adhesion | 0.0090771 | 61 |
| GO:0016188 synaptic vesicle maturation | 0.0093136 | 12 |
| GO:1902041 regulation of extrinsic apoptotic signaling pathway via death domain receptors | 0.0097661 | 49 |
| GO:0003353 positive regulation of cilium movement | 0.0102330 | 12 |
| GO:0048875 chemical homeostasis within a tissue | 0.0103053 | 14 |
| GO:0034112 positive regulation of homotypic cell-cell adhesion | 0.0106336 | 13 |
| GO:0051346 negative regulation of hydrolase activity | 0.0108489 | 376 |
| GO:0002887 negative regulation of myeloid leukocyte mediated immunity | 0.0115473 | 10 |
GO Biological Process Stats
code
# knitr::kable(lapply(go_mf_res, head))
# tb <- lapply(go_bp_res, head)
knitr::kable(go_tb_bp$stats)| stat.mean | exp1 | |
|---|---|---|
| GO:0071609 chemokine (C-C motif) ligand 5 production | 4.880706 | 4.880706 |
| GO:0071649 regulation of chemokine (C-C motif) ligand 5 production | 4.880706 | 4.880706 |
| GO:1901215 negative regulation of neuron death | 3.244345 | 3.244345 |
| GO:0060416 response to growth hormone | 3.339453 | 3.339453 |
| GO:0014743 regulation of muscle hypertrophy | 3.225208 | 3.225208 |
| GO:0014741 negative regulation of muscle hypertrophy | 3.240404 | 3.240404 |
| GO:0003306 Wnt signaling pathway involved in heart development | 3.481904 | 3.481904 |
| GO:0061050 regulation of cell growth involved in cardiac muscle cell development | 3.183913 | 3.183913 |
| GO:0010611 regulation of cardiac muscle hypertrophy | 2.993449 | 2.993449 |
| GO:0061512 protein localization to cilium | 2.933137 | 2.933137 |
| GO:0046643 regulation of gamma-delta T cell activation | 3.220632 | 3.220632 |
| GO:1902959 regulation of aspartic-type endopeptidase activity involved in amyloid precursor protein catabolic process | 3.324313 | 3.324313 |
| GO:0031667 response to nutrient levels | 2.840317 | 2.840317 |
| GO:0048261 negative regulation of receptor-mediated endocytosis | 2.933674 | 2.933674 |
| GO:0022900 electron transport chain | 2.828983 | 2.828983 |
| GO:0010614 negative regulation of cardiac muscle hypertrophy | 2.902096 | 2.902096 |
| GO:0010288 response to lead ion | 2.934375 | 2.934375 |
| GO:0032094 response to food | 2.861223 | 2.861223 |
| GO:0019646 aerobic electron transport chain | 2.804743 | 2.804743 |
| GO:0050686 negative regulation of mRNA processing | 2.832414 | 2.832414 |
| GO:0014896 muscle hypertrophy | 2.747886 | 2.747886 |
| GO:0043502 regulation of muscle adaptation | 2.747164 | 2.747164 |
| GO:0002679 respiratory burst involved in defense response | 2.874811 | 2.874811 |
| GO:0099068 postsynapse assembly | 2.772064 | 2.772064 |
| GO:0071378 cellular response to growth hormone stimulus | 2.788842 | 2.788842 |
| GO:0042773 ATP synthesis coupled electron transport | 2.658472 | 2.658472 |
| GO:0042775 mitochondrial ATP synthesis coupled electron transport | 2.658472 | 2.658472 |
| GO:0031398 positive regulation of protein ubiquitination | 2.642937 | 2.642937 |
| GO:0031058 positive regulation of histone modification | 2.643830 | 2.643830 |
| GO:0006869 lipid transport | 2.618481 | 2.618481 |
| GO:0045806 negative regulation of endocytosis | 2.652521 | 2.652521 |
| GO:0006120 mitochondrial electron transport, NADH to ubiquinone | 2.653918 | 2.653918 |
| GO:0006119 oxidative phosphorylation | 2.612955 | 2.612955 |
| GO:2000252 negative regulation of feeding behavior | 2.907519 | 2.907519 |
| GO:0007422 peripheral nervous system development | 2.622116 | 2.622116 |
| GO:0003300 cardiac muscle hypertrophy | 2.599352 | 2.599352 |
| GO:0014897 striated muscle hypertrophy | 2.583056 | 2.583056 |
| GO:0022904 respiratory electron transport chain | 2.572935 | 2.572935 |
| GO:0032372 negative regulation of sterol transport | 2.639198 | 2.639198 |
| GO:0032375 negative regulation of cholesterol transport | 2.639198 | 2.639198 |
| GO:0007595 lactation | 2.594743 | 2.594743 |
| GO:0030879 mammary gland development | 2.549205 | 2.549205 |
| GO:0070997 neuron death | 2.524079 | 2.524079 |
| GO:1903322 positive regulation of protein modification by small protein conjugation or removal | 2.529597 | 2.529597 |
| GO:1905288 vascular associated smooth muscle cell apoptotic process | 2.677105 | 2.677105 |
| GO:1905459 regulation of vascular associated smooth muscle cell apoptotic process | 2.677105 | 2.677105 |
| GO:0043434 response to peptide hormone | 2.507894 | 2.507894 |
| GO:0098903 regulation of membrane repolarization during action potential | 2.768572 | 2.768572 |
| GO:1901214 regulation of neuron death | 2.494895 | 2.494895 |
| GO:0043984 histone H4-K16 acetylation | 2.669903 | 2.669903 |
GO Molecular Function
code
go_mf_res <- gage(fold_changes, gsets = go_mf, same.dir = TRUE)
go_tb_mf <- lapply(go_mf_res, function(x) head(x, n = 50))
GO Molecular Function Greater
code
# tb <- lapply(go_mf_res, head)
knitr::kable(go_tb_mf$greater[, c(3, 5)])| p.val | set.size | |
|---|---|---|
| GO:0009055 electron transfer activity | 0.0012250 | 124 |
| GO:0022804 active transmembrane transporter activity | 0.0022176 | 405 |
| GO:0015294 solute:cation symporter activity | 0.0026727 | 104 |
| GO:0015293 symporter activity | 0.0029460 | 144 |
| GO:0015081 sodium ion transmembrane transporter activity | 0.0044063 | 152 |
| GO:0015291 secondary active transmembrane transporter activity | 0.0052966 | 240 |
| GO:0097110 scaffold protein binding | 0.0069101 | 67 |
| GO:0015453 oxidoreduction-driven active transmembrane transporter activity | 0.0084670 | 71 |
| GO:0034979 NAD-dependent protein deacetylase activity | 0.0085587 | 16 |
| GO:0016763 pentosyltransferase activity | 0.0090458 | 49 |
| GO:0015370 solute:sodium symporter activity | 0.0094375 | 73 |
| GO:0005179 hormone activity | 0.0105309 | 121 |
| GO:0017136 NAD-dependent histone deacetylase activity | 0.0105378 | 15 |
| GO:0102545 phosphatidyl phospholipase B activity | 0.0110496 | 11 |
| GO:0022853 active ion transmembrane transporter activity | 0.0116501 | 266 |
| GO:0042562 hormone binding | 0.0138509 | 86 |
| GO:0016500 protein-hormone receptor activity | 0.0149203 | 20 |
| GO:0071855 neuropeptide receptor binding | 0.0151939 | 36 |
| GO:0004806 triglyceride lipase activity | 0.0157966 | 26 |
| GO:0003955 NAD(P)H dehydrogenase (quinone) activity | 0.0179536 | 45 |
| GO:0008395 steroid hydroxylase activity | 0.0180531 | 37 |
| GO:0047485 protein N-terminus binding | 0.0182331 | 110 |
| GO:0005432 calcium:sodium antiporter activity | 0.0183425 | 10 |
| GO:0050136 NADH dehydrogenase (quinone) activity | 0.0201588 | 43 |
| GO:0070403 NAD+ binding | 0.0208475 | 16 |
| GO:0008137 NADH dehydrogenase (ubiquinone) activity | 0.0213663 | 42 |
| GO:0003954 NADH dehydrogenase activity | 0.0214958 | 45 |
| GO:0042043 neurexin family protein binding | 0.0216490 | 15 |
| GO:0035198 miRNA binding | 0.0217698 | 33 |
| GO:0044183 protein folding chaperone | 0.0242248 | 39 |
| GO:0016655 oxidoreductase activity, acting on NAD(P)H, quinone or similar compound as acceptor | 0.0264264 | 57 |
| GO:0050998 nitric-oxide synthase binding | 0.0265653 | 15 |
| GO:0015125 bile acid transmembrane transporter activity | 0.0271933 | 21 |
| GO:0005549 odorant binding | 0.0283825 | 113 |
| GO:0005521 lamin binding | 0.0286804 | 16 |
| GO:0005200 structural constituent of cytoskeleton | 0.0296719 | 102 |
| GO:0016866 intramolecular transferase activity | 0.0297290 | 27 |
| GO:0015491 cation:cation antiporter activity | 0.0311391 | 27 |
| GO:0140161 monocarboxylate:sodium symporter activity | 0.0338766 | 11 |
| GO:0043024 ribosomal small subunit binding | 0.0355543 | 17 |
| GO:0022821 potassium ion antiporter activity | 0.0388693 | 16 |
| GO:0009982 pseudouridine synthase activity | 0.0398042 | 13 |
| GO:0046332 SMAD binding | 0.0398780 | 79 |
| GO:0016857 racemase and epimerase activity, acting on carbohydrates and derivatives | 0.0413244 | 11 |
| GO:0005338 nucleotide-sugar transmembrane transporter activity | 0.0419804 | 12 |
| GO:0052740 1-acyl-2-lysophosphatidylserine acylhydrolase activity | 0.0424136 | 10 |
| GO:0051287 NAD binding | 0.0430959 | 56 |
| GO:0005313 L-glutamate transmembrane transporter activity | 0.0476706 | 14 |
| GO:0005528 FK506 binding | 0.0489066 | 10 |
| GO:0005527 macrolide binding | 0.0491794 | 12 |
GO Molecular Function Less
code
# knitr::kable(lapply(go_mf_res, head))
# tb <- lapply(go_mf_res, head)
knitr::kable(go_tb_mf$less[, c(3, 5)])| p.val | set.size | |
|---|---|---|
| GO:0005385 zinc ion transmembrane transporter activity | 0.0016609 | 21 |
| GO:0005178 integrin binding | 0.0028846 | 144 |
| GO:0050840 extracellular matrix binding | 0.0046958 | 56 |
| GO:0005504 fatty acid binding | 0.0049193 | 39 |
| GO:0003785 actin monomer binding | 0.0057485 | 28 |
| GO:0098918 structural constituent of synapse | 0.0066312 | 17 |
| GO:0004861 cyclin-dependent protein serine/threonine kinase inhibitor activity | 0.0072965 | 12 |
| GO:0030552 cAMP binding | 0.0078974 | 23 |
| GO:0046915 transition metal ion transmembrane transporter activity | 0.0080325 | 37 |
| GO:0004033 aldo-keto reductase (NADP) activity | 0.0091281 | 29 |
| GO:0042805 actinin binding | 0.0096979 | 36 |
| GO:0004867 serine-type endopeptidase inhibitor activity | 0.0110600 | 97 |
| GO:0016780 phosphotransferase activity, for other substituted phosphate groups | 0.0125609 | 20 |
| GO:0070739 protein-glutamic acid ligase activity | 0.0133282 | 10 |
| GO:0070740 tubulin-glutamic acid ligase activity | 0.0133282 | 10 |
| GO:0016667 oxidoreductase activity, acting on a sulfur group of donors | 0.0137519 | 57 |
| GO:0033293 monocarboxylic acid binding | 0.0154153 | 72 |
| GO:1902282 voltage-gated potassium channel activity involved in ventricular cardiac muscle cell action potential repolarization | 0.0168236 | 12 |
| GO:0008195 phosphatidate phosphatase activity | 0.0185426 | 13 |
| GO:0050664 oxidoreductase activity, acting on NAD(P)H, oxygen as acceptor | 0.0197186 | 15 |
| GO:0052650 NADP-retinol dehydrogenase activity | 0.0205203 | 13 |
| GO:0097493 structural molecule activity conferring elasticity | 0.0206266 | 11 |
| GO:0005221 intracellular cyclic nucleotide activated cation channel activity | 0.0208767 | 12 |
| GO:0043855 cyclic nucleotide-gated ion channel activity | 0.0208767 | 12 |
| GO:0042288 MHC class I protein binding | 0.0226869 | 20 |
| GO:0008106 alcohol dehydrogenase (NADP+) activity | 0.0234543 | 22 |
| GO:0008139 nuclear localization sequence binding | 0.0256065 | 26 |
| GO:0140104 molecular carrier activity | 0.0276152 | 73 |
| GO:0099094 ligand-gated cation channel activity | 0.0276584 | 113 |
| GO:0003995 acyl-CoA dehydrogenase activity | 0.0279576 | 12 |
| GO:0030551 cyclic nucleotide binding | 0.0288604 | 37 |
| GO:0008009 chemokine activity | 0.0328162 | 47 |
| GO:0015036 disulfide oxidoreductase activity | 0.0332401 | 42 |
| GO:0004197 cysteine-type endopeptidase activity | 0.0341903 | 118 |
| GO:0050699 WW domain binding | 0.0346015 | 32 |
| GO:0015035 protein-disulfide reductase activity | 0.0352903 | 37 |
| GO:0140312 cargo adaptor activity | 0.0361679 | 20 |
| GO:0050660 flavin adenine dinucleotide binding | 0.0364524 | 85 |
| GO:0002162 dystroglycan binding | 0.0381998 | 11 |
| GO:1990380 Lys48-specific deubiquitinase activity | 0.0383897 | 16 |
| GO:0043394 proteoglycan binding | 0.0384633 | 36 |
| GO:0140142 nucleocytoplasmic carrier activity | 0.0391053 | 31 |
| GO:0005251 delayed rectifier potassium channel activity | 0.0395248 | 33 |
| GO:0035615 clathrin adaptor activity | 0.0399977 | 19 |
| GO:0005080 protein kinase C binding | 0.0400473 | 55 |
| GO:0005518 collagen binding | 0.0417337 | 69 |
| GO:0031406 carboxylic acid binding | 0.0417466 | 174 |
| GO:0016209 antioxidant activity | 0.0432258 | 85 |
| GO:0042577 lipid phosphatase activity | 0.0436530 | 16 |
| GO:0005201 extracellular matrix structural constituent | 0.0439658 | 172 |
GO Molecular Function Stats
code
# knitr::kable(lapply(go_mf_res, head))
# tb <- lapply(go_mf_res, head)
knitr::kable(go_tb_mf$stats)| stat.mean | exp1 | |
|---|---|---|
| GO:0009055 electron transfer activity | 3.062985 | 3.062985 |
| GO:0022804 active transmembrane transporter activity | 2.853597 | 2.853597 |
| GO:0015294 solute:cation symporter activity | 2.815467 | 2.815467 |
| GO:0015293 symporter activity | 2.774581 | 2.774581 |
| GO:0015081 sodium ion transmembrane transporter activity | 2.636474 | 2.636474 |
| GO:0015291 secondary active transmembrane transporter activity | 2.566090 | 2.566090 |
| GO:0097110 scaffold protein binding | 2.497678 | 2.497678 |
| GO:0015453 oxidoreduction-driven active transmembrane transporter activity | 2.418785 | 2.418785 |
| GO:0034979 NAD-dependent protein deacetylase activity | 2.526439 | 2.526439 |
| GO:0016763 pentosyltransferase activity | 2.405106 | 2.405106 |
| GO:0015370 solute:sodium symporter activity | 2.374905 | 2.374905 |
| GO:0005179 hormone activity | 2.322239 | 2.322239 |
| GO:0017136 NAD-dependent histone deacetylase activity | 2.446214 | 2.446214 |
| GO:0102545 phosphatidyl phospholipase B activity | 2.500134 | 2.500134 |
| GO:0022853 active ion transmembrane transporter activity | 2.275162 | 2.275162 |
| GO:0042562 hormone binding | 2.220632 | 2.220632 |
| GO:0016500 protein-hormone receptor activity | 2.258888 | 2.258888 |
| GO:0071855 neuropeptide receptor binding | 2.210495 | 2.210495 |
| GO:0004806 triglyceride lipase activity | 2.215663 | 2.215663 |
| GO:0003955 NAD(P)H dehydrogenase (quinone) activity | 2.135185 | 2.135185 |
| GO:0008395 steroid hydroxylase activity | 2.136135 | 2.136135 |
| GO:0047485 protein N-terminus binding | 2.104693 | 2.104693 |
| GO:0005432 calcium:sodium antiporter activity | 2.270979 | 2.270979 |
| GO:0050136 NADH dehydrogenase (quinone) activity | 2.087198 | 2.087198 |
| GO:0070403 NAD+ binding | 2.128131 | 2.128131 |
| GO:0008137 NADH dehydrogenase (ubiquinone) activity | 2.062785 | 2.062785 |
| GO:0003954 NADH dehydrogenase activity | 2.057350 | 2.057350 |
| GO:0042043 neurexin family protein binding | 2.120670 | 2.120670 |
| GO:0035198 miRNA binding | 2.067222 | 2.067222 |
| GO:0044183 protein folding chaperone | 2.006176 | 2.006176 |
| GO:0016655 oxidoreductase activity, acting on NAD(P)H, quinone or similar compound as acceptor | 1.959310 | 1.959310 |
| GO:0050998 nitric-oxide synthase binding | 2.019221 | 2.019221 |
| GO:0015125 bile acid transmembrane transporter activity | 1.990300 | 1.990300 |
| GO:0005549 odorant binding | 1.915126 | 1.915126 |
| GO:0005521 lamin binding | 1.977247 | 1.977247 |
| GO:0005200 structural constituent of cytoskeleton | 1.896341 | 1.896341 |
| GO:0016866 intramolecular transferase activity | 1.927509 | 1.927509 |
| GO:0015491 cation:cation antiporter activity | 1.905475 | 1.905475 |
| GO:0140161 monocarboxylate:sodium symporter activity | 1.932305 | 1.932305 |
| GO:0043024 ribosomal small subunit binding | 1.868084 | 1.868084 |
| GO:0022821 potassium ion antiporter activity | 1.829496 | 1.829496 |
| GO:0009982 pseudouridine synthase activity | 1.832212 | 1.832212 |
| GO:0046332 SMAD binding | 1.764231 | 1.764231 |
| GO:0016857 racemase and epimerase activity, acting on carbohydrates and derivatives | 1.841072 | 1.841072 |
| GO:0005338 nucleotide-sugar transmembrane transporter activity | 1.812019 | 1.812019 |
| GO:0052740 1-acyl-2-lysophosphatidylserine acylhydrolase activity | 1.845056 | 1.845056 |
| GO:0051287 NAD binding | 1.731390 | 1.731390 |
| GO:0005313 L-glutamate transmembrane transporter activity | 1.731030 | 1.731030 |
| GO:0005528 FK506 binding | 1.751576 | 1.751576 |
| GO:0005527 macrolide binding | 1.732144 | 1.732144 |
GO Cellecular Location
code
go_cl_res <- gage(fold_changes, gsets = go_cc, same.dir = TRUE)
go_tb_cl <- lapply(go_cl_res, function(x) head(x, n = 50))
# tb <- lapply(go_cl_res, head)
GO Cellular Location Greater
code
knitr::kable(go_tb_cl$greater[, c(3, 5)])| p.val | set.size | |
|---|---|---|
| GO:0071014 post-mRNA release spliceosomal complex | 0.0019537 | 12 |
| GO:0005657 replication fork | 0.0037185 | 60 |
| GO:0016607 nuclear speck | 0.0087334 | 410 |
| GO:0008023 transcription elongation factor complex | 0.0111795 | 46 |
| GO:0030137 COPI-coated vesicle | 0.0132516 | 28 |
| GO:1990907 beta-catenin-TCF complex | 0.0176786 | 13 |
| GO:0043194 axon initial segment | 0.0190746 | 15 |
| GO:0099699 integral component of synaptic membrane | 0.0200105 | 150 |
| GO:0031248 protein acetyltransferase complex | 0.0215823 | 85 |
| GO:1902493 acetyltransferase complex | 0.0215823 | 85 |
| GO:0005743 mitochondrial inner membrane | 0.0223436 | 491 |
| GO:0008250 oligosaccharyltransferase complex | 0.0224620 | 13 |
| GO:0030126 COPI vesicle coat | 0.0233798 | 13 |
| GO:0032279 asymmetric synapse | 0.0241341 | 335 |
| GO:0098800 inner mitochondrial membrane protein complex | 0.0251463 | 144 |
| GO:0030663 COPI-coated vesicle membrane | 0.0254135 | 18 |
| GO:0099240 intrinsic component of synaptic membrane | 0.0255479 | 163 |
| GO:0098984 neuron to neuron synapse | 0.0256736 | 361 |
| GO:0030660 Golgi-associated vesicle membrane | 0.0256749 | 54 |
| GO:0099055 integral component of postsynaptic membrane | 0.0262213 | 117 |
| GO:0001518 voltage-gated sodium channel complex | 0.0282491 | 17 |
| GO:0098803 respiratory chain complex | 0.0320252 | 88 |
| GO:0000123 histone acetyltransferase complex | 0.0339904 | 75 |
| GO:0043083 synaptic cleft | 0.0344366 | 17 |
| GO:0098992 neuronal dense core vesicle | 0.0356059 | 12 |
| GO:0035578 azurophil granule lumen | 0.0358541 | 91 |
| GO:0098798 mitochondrial protein-containing complex | 0.0362127 | 265 |
| GO:0099522 cytosolic region | 0.0366217 | 21 |
| GO:0034045 phagophore assembly site membrane | 0.0371312 | 15 |
| GO:0015935 small ribosomal subunit | 0.0374109 | 71 |
| GO:0070469 respirasome | 0.0393415 | 98 |
| GO:0016363 nuclear matrix | 0.0410295 | 111 |
| GO:0032806 carboxy-terminal domain protein kinase complex | 0.0425625 | 18 |
| GO:0098686 hippocampal mossy fiber to CA3 synapse | 0.0429956 | 33 |
| GO:0010369 chromocenter | 0.0450690 | 14 |
| GO:0099572 postsynaptic specialization | 0.0464314 | 356 |
| GO:0098936 intrinsic component of postsynaptic membrane | 0.0465763 | 122 |
| GO:0045179 apical cortex | 0.0467287 | 10 |
| GO:1902562 H4 histone acetyltransferase complex | 0.0469371 | 32 |
| GO:0005746 mitochondrial respirasome | 0.0492352 | 87 |
| GO:0048787 presynaptic active zone membrane | 0.0503972 | 28 |
| GO:0016328 lateral plasma membrane | 0.0504626 | 61 |
| GO:0005921 gap junction | 0.0517475 | 32 |
| GO:0005775 vacuolar lumen | 0.0527856 | 174 |
| GO:0032040 small-subunit processome | 0.0542672 | 39 |
| GO:0016282 eukaryotic 43S preinitiation complex | 0.0547375 | 17 |
| GO:0048786 presynaptic active zone | 0.0548842 | 73 |
| GO:0043034 costamere | 0.0563827 | 18 |
| GO:0005747 mitochondrial respiratory chain complex I | 0.0571495 | 48 |
| GO:0030964 NADH dehydrogenase complex | 0.0571495 | 48 |
GO Cellular Location Less
code
knitr::kable(go_tb_cl$less[, c(3, 5)])| p.val | set.size | |
|---|---|---|
| GO:0005643 nuclear pore | 0.0014972 | 83 |
| GO:0044615 nuclear pore nuclear basket | 0.0034355 | 12 |
| GO:0000779 condensed chromosome, centromeric region | 0.0037488 | 144 |
| GO:0000776 kinetochore | 0.0041344 | 134 |
| GO:0030673 axolemma | 0.0062978 | 15 |
| GO:0097504 Gemini of coiled bodies | 0.0075552 | 11 |
| GO:0098636 protein complex involved in cell adhesion | 0.0106165 | 36 |
| GO:0018995 host cellular component | 0.0110735 | 12 |
| GO:0043657 host cell | 0.0110735 | 12 |
| GO:0008305 integrin complex | 0.0118265 | 31 |
| GO:0030667 secretory granule membrane | 0.0130406 | 309 |
| GO:0000137 Golgi cis cisterna | 0.0139126 | 30 |
| GO:0000793 condensed chromosome | 0.0176686 | 241 |
| GO:0030669 clathrin-coated endocytic vesicle membrane | 0.0245568 | 69 |
| GO:0005790 smooth endoplasmic reticulum | 0.0260841 | 33 |
| GO:0000775 chromosome, centromeric region | 0.0279147 | 198 |
| GO:0036452 ESCRT complex | 0.0295755 | 26 |
| GO:0005795 Golgi stack | 0.0334525 | 155 |
| GO:0031093 platelet alpha granule lumen | 0.0346902 | 67 |
| GO:0070821 tertiary granule membrane | 0.0351461 | 72 |
| GO:0000800 lateral element | 0.0387019 | 13 |
| GO:0005903 brush border | 0.0396533 | 106 |
| GO:0044305 calyx of Held | 0.0417211 | 20 |
| GO:0045095 keratin filament | 0.0427078 | 95 |
| GO:0031526 brush border membrane | 0.0442557 | 58 |
| GO:0045334 clathrin-coated endocytic vesicle | 0.0467835 | 88 |
| GO:0005604 basement membrane | 0.0478439 | 95 |
| GO:0035327 transcriptionally active chromatin | 0.0495896 | 24 |
| GO:0061702 inflammasome complex | 0.0497802 | 16 |
| GO:0042405 nuclear inclusion body | 0.0505213 | 13 |
| GO:0005777 peroxisome | 0.0508432 | 142 |
| GO:0042579 microbody | 0.0508432 | 142 |
| GO:0045111 intermediate filament cytoskeleton | 0.0565650 | 247 |
| GO:0005782 peroxisomal matrix | 0.0571346 | 51 |
| GO:0031907 microbody lumen | 0.0571346 | 51 |
| GO:0034708 methyltransferase complex | 0.0607484 | 88 |
| GO:0046930 pore complex | 0.0610965 | 26 |
| GO:0000176 nuclear exosome (RNase complex) | 0.0620864 | 12 |
| GO:0043256 laminin complex | 0.0627724 | 12 |
| GO:0031985 Golgi cisterna | 0.0672739 | 121 |
| GO:0030132 clathrin coat of coated pit | 0.0695598 | 14 |
| GO:0030666 endocytic vesicle membrane | 0.0700316 | 189 |
| GO:0000795 synaptonemal complex | 0.0720417 | 42 |
| GO:0099086 synaptonemal structure | 0.0720417 | 42 |
| GO:0001669 acrosomal vesicle | 0.0752486 | 121 |
| GO:0032589 neuron projection membrane | 0.0763747 | 62 |
| GO:0005583 fibrillar collagen trimer | 0.0769576 | 12 |
| GO:0098643 banded collagen fibril | 0.0769576 | 12 |
| GO:0097524 sperm plasma membrane | 0.0774959 | 12 |
| GO:0005765 lysosomal membrane | 0.0788613 | 391 |
GO Cellular Location Stats
code
knitr::kable(go_tb_cl$stats)| stat.mean | exp1 | |
|---|---|---|
| GO:0071014 post-mRNA release spliceosomal complex | 3.223741 | 3.223741 |
| GO:0005657 replication fork | 2.723785 | 2.723785 |
| GO:0016607 nuclear speck | 2.381575 | 2.381575 |
| GO:0008023 transcription elongation factor complex | 2.326257 | 2.326257 |
| GO:0030137 COPI-coated vesicle | 2.284064 | 2.284064 |
| GO:1990907 beta-catenin-TCF complex | 2.240345 | 2.240345 |
| GO:0043194 axon initial segment | 2.176055 | 2.176055 |
| GO:0099699 integral component of synaptic membrane | 2.062566 | 2.062566 |
| GO:0031248 protein acetyltransferase complex | 2.038746 | 2.038746 |
| GO:1902493 acetyltransferase complex | 2.038746 | 2.038746 |
| GO:0005743 mitochondrial inner membrane | 2.010171 | 2.010171 |
| GO:0008250 oligosaccharyltransferase complex | 2.119449 | 2.119449 |
| GO:0030126 COPI vesicle coat | 2.111817 | 2.111817 |
| GO:0032279 asymmetric synapse | 1.978637 | 1.978637 |
| GO:0098800 inner mitochondrial membrane protein complex | 1.965969 | 1.965969 |
| GO:0030663 COPI-coated vesicle membrane | 2.025454 | 2.025454 |
| GO:0099240 intrinsic component of synaptic membrane | 1.957933 | 1.957933 |
| GO:0098984 neuron to neuron synapse | 1.951821 | 1.951821 |
| GO:0030660 Golgi-associated vesicle membrane | 1.972198 | 1.972198 |
| GO:0099055 integral component of postsynaptic membrane | 1.949491 | 1.949491 |
| GO:0001518 voltage-gated sodium channel complex | 1.978871 | 1.978871 |
| GO:0098803 respiratory chain complex | 1.864359 | 1.864359 |
| GO:0000123 histone acetyltransferase complex | 1.839862 | 1.839862 |
| GO:0043083 synaptic cleft | 1.888017 | 1.888017 |
| GO:0098992 neuronal dense core vesicle | 1.904927 | 1.904927 |
| GO:0035578 azurophil granule lumen | 1.811687 | 1.811687 |
| GO:0098798 mitochondrial protein-containing complex | 1.800063 | 1.800063 |
| GO:0099522 cytosolic region | 1.840251 | 1.840251 |
| GO:0034045 phagophore assembly site membrane | 1.860532 | 1.860532 |
| GO:0015935 small ribosomal subunit | 1.795258 | 1.795258 |
| GO:0070469 respirasome | 1.768037 | 1.768037 |
| GO:0016363 nuclear matrix | 1.747014 | 1.747014 |
| GO:0032806 carboxy-terminal domain protein kinase complex | 1.773620 | 1.773620 |
| GO:0098686 hippocampal mossy fiber to CA3 synapse | 1.744043 | 1.744043 |
| GO:0010369 chromocenter | 1.760365 | 1.760365 |
| GO:0099572 postsynaptic specialization | 1.682755 | 1.682755 |
| GO:0098936 intrinsic component of postsynaptic membrane | 1.685651 | 1.685651 |
| GO:0045179 apical cortex | 1.773718 | 1.773718 |
| GO:1902562 H4 histone acetyltransferase complex | 1.706611 | 1.706611 |
| GO:0005746 mitochondrial respirasome | 1.661796 | 1.661796 |
| GO:0048787 presynaptic active zone membrane | 1.669792 | 1.669792 |
| GO:0016328 lateral plasma membrane | 1.653221 | 1.653221 |
| GO:0005921 gap junction | 1.652568 | 1.652568 |
| GO:0005775 vacuolar lumen | 1.622674 | 1.622674 |
| GO:0032040 small-subunit processome | 1.625023 | 1.625023 |
| GO:0016282 eukaryotic 43S preinitiation complex | 1.646858 | 1.646858 |
| GO:0048786 presynaptic active zone | 1.609184 | 1.609184 |
| GO:0043034 costamere | 1.628725 | 1.628725 |
| GO:0005747 mitochondrial respiratory chain complex I | 1.595526 | 1.595526 |
| GO:0030964 NADH dehydrogenase complex | 1.595526 | 1.595526 |
References
Gene Ontology Consortium. “The Gene Ontology (GO) database and informatics resource.” Nucleic acids research 32.suppl_1 (2004): D258-D261.
Kanehisa, Minoru, et al. “KEGG for linking genomes to life and the environment.” Nucleic acids research 36.suppl_1 (2007): D480-D484.
Love MI, Huber W, Anders S (2014). “Moderated estimation of fold change and dispersion for RNA-seq data with DESeq2.” Genome Biology, 15, 550. doi: 10.1186/s13059-014-0550-8.
Luo, Weijun, Friedman, Michael, Shedden, Kerby, Hankenson, Kurt, Woolf, Peter (2009). “GAGE: generally applicable gene set enrichment for pathway analysis.” BMC Bioinformatics, 10, 161.
Luo, Weijun, Brouwer, Cory (2013). “Pathview: an R/Bioconductor package for pathway-based data integration and visualization.” Bioinformatics, 29(14), 1830-1831. doi: 10.1093/bioinformatics/btt285.